Next Webinar →Count Shipped: May 26 | 27 MAY
Back to gallery

GA4 Website Analytics Metric Map

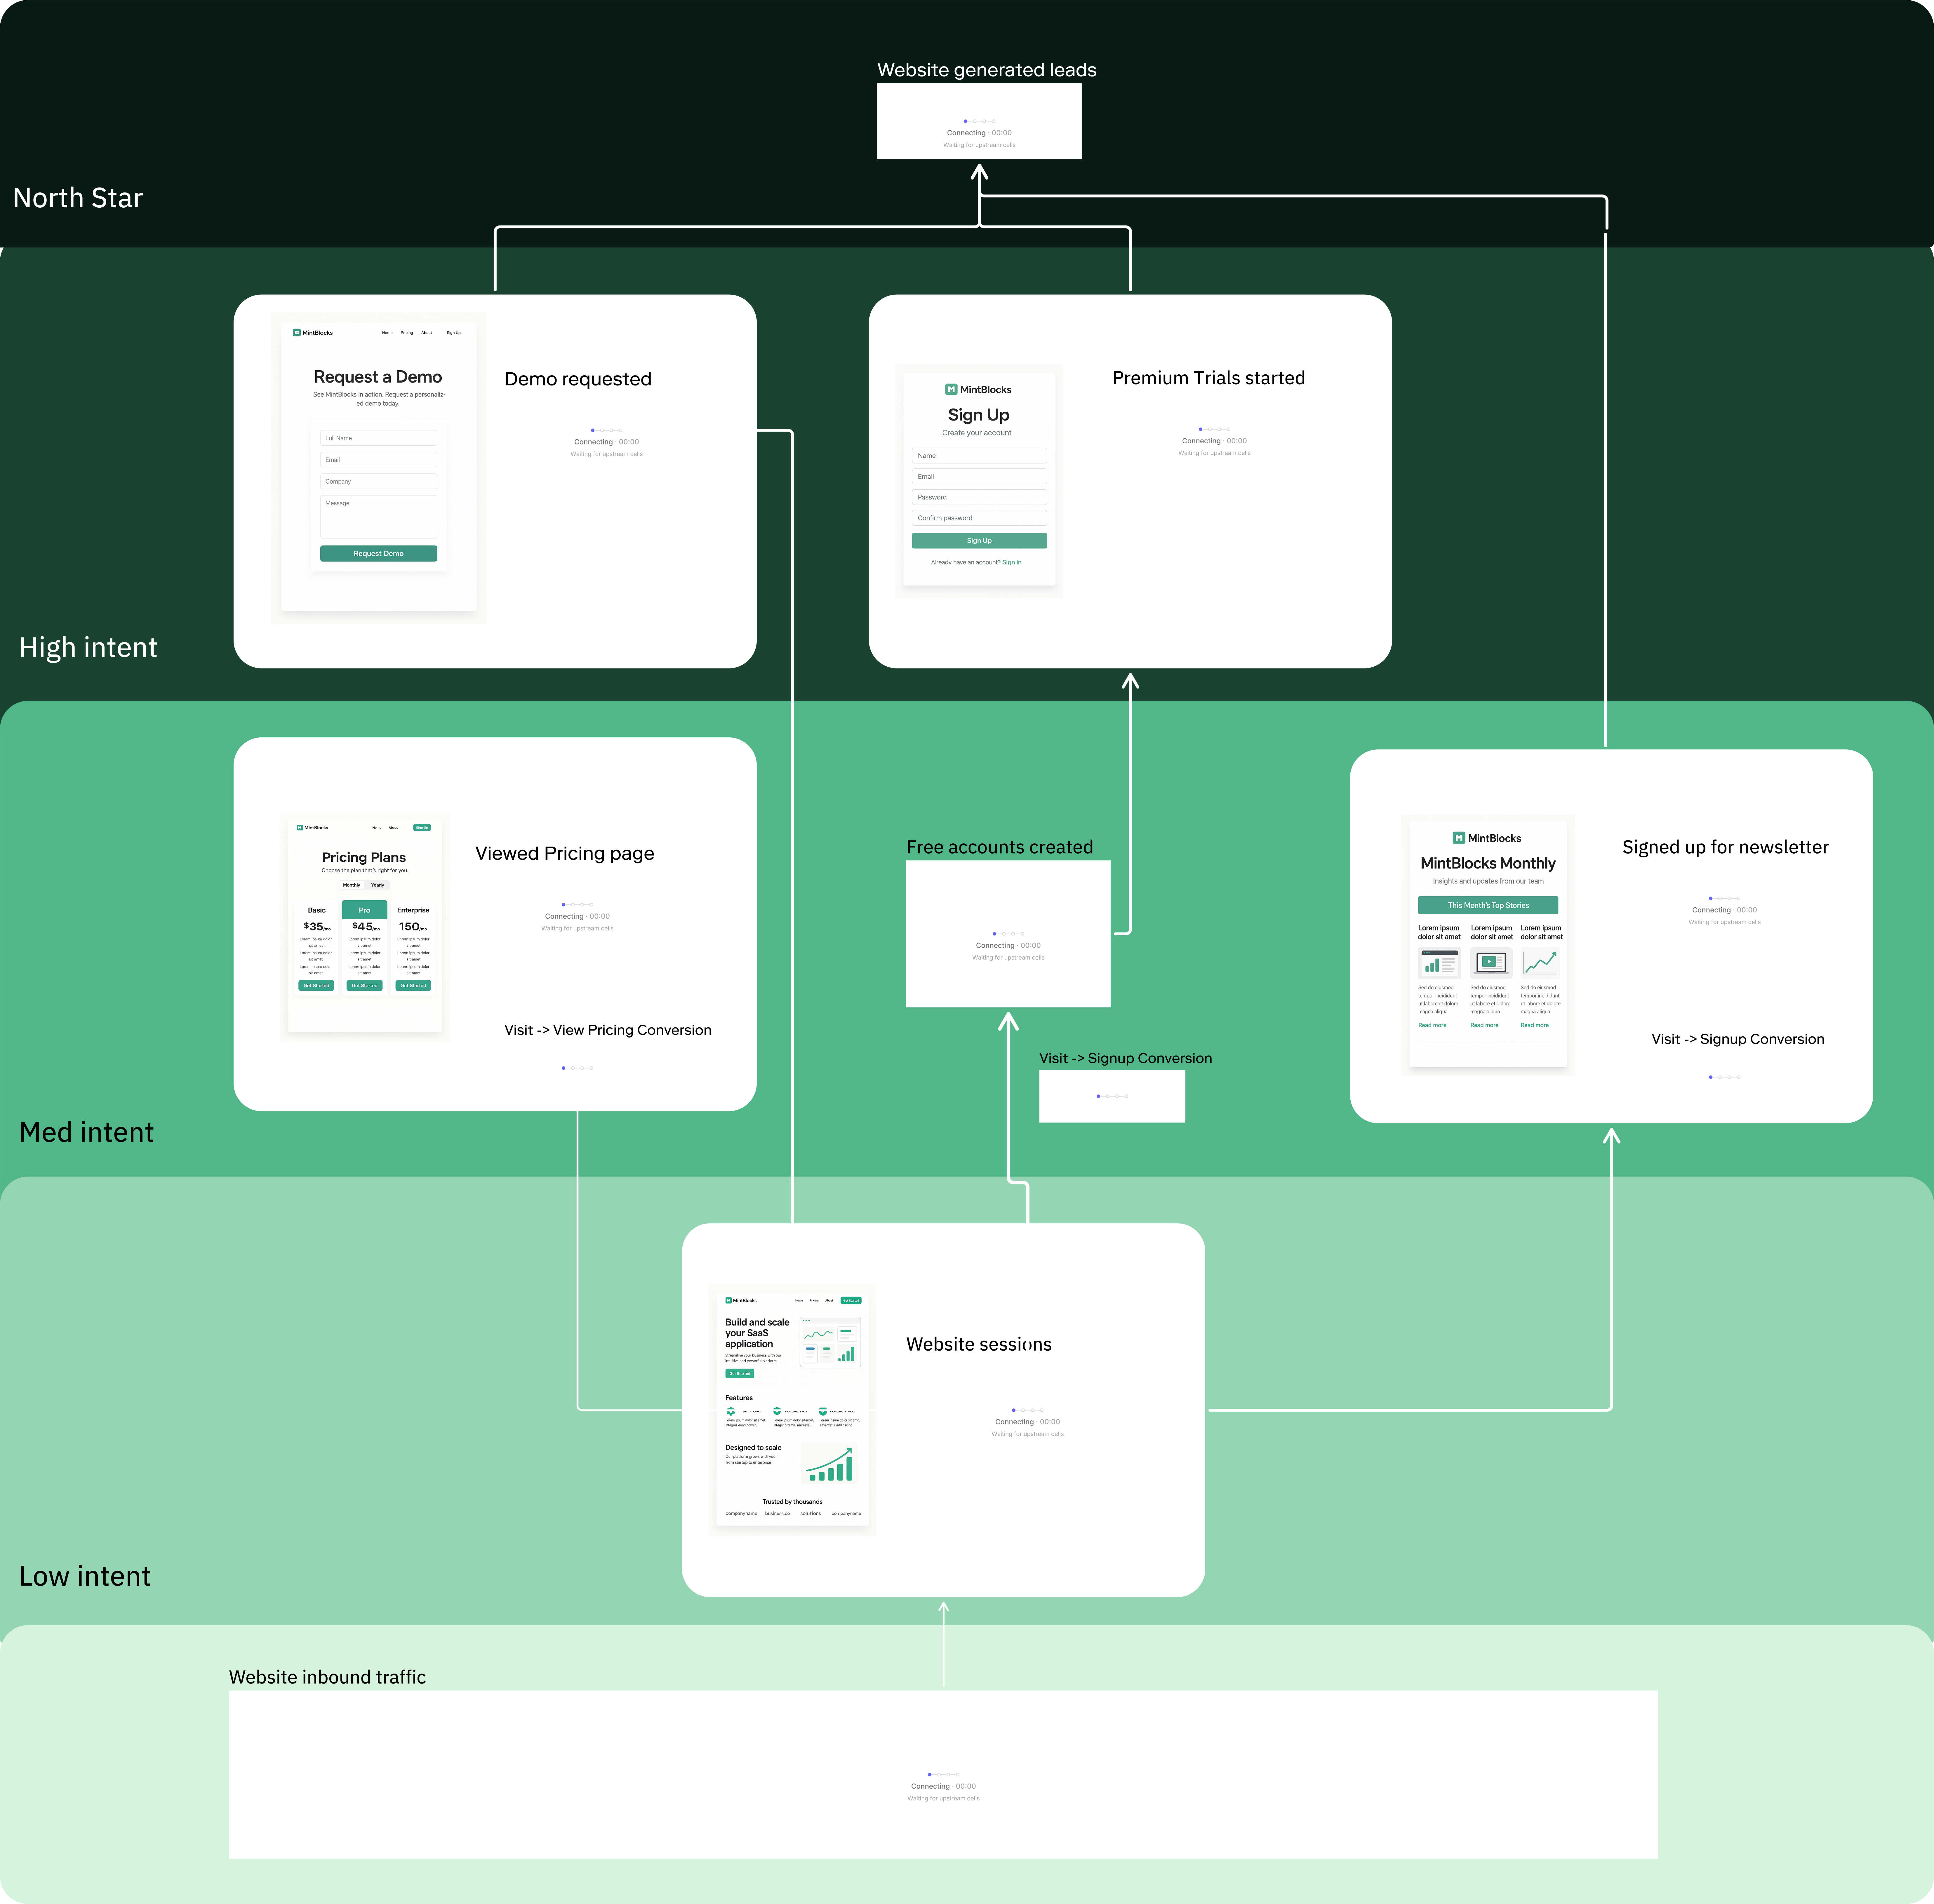
A metric map of your GA4 data to show how your website activity impacts your overall business goals.

Try this canvas
GA4 Website Analytics Metric Map

Problem

Website analytics are laid out in GA4 as just a collection of numbers and events, with very little context provided into what these numbers mean and how they interplay with each other.

Solution

Export GA4 events into BigQuery and model the data into a metric map to visualize how the website analytics and key events lead up to an overall more meaningful metric.

Impact

Anyone can now gain a high-level, clear visual on how the website is performing and understand the impact it's having on the business.
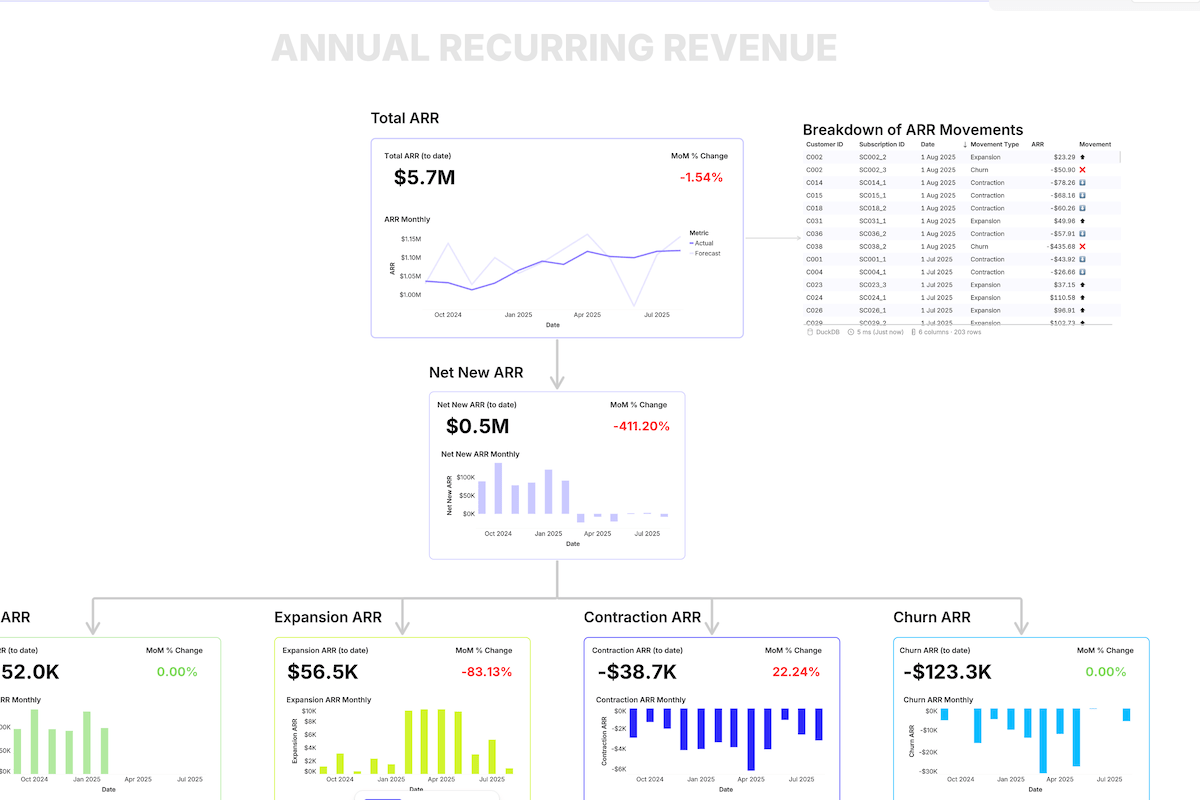
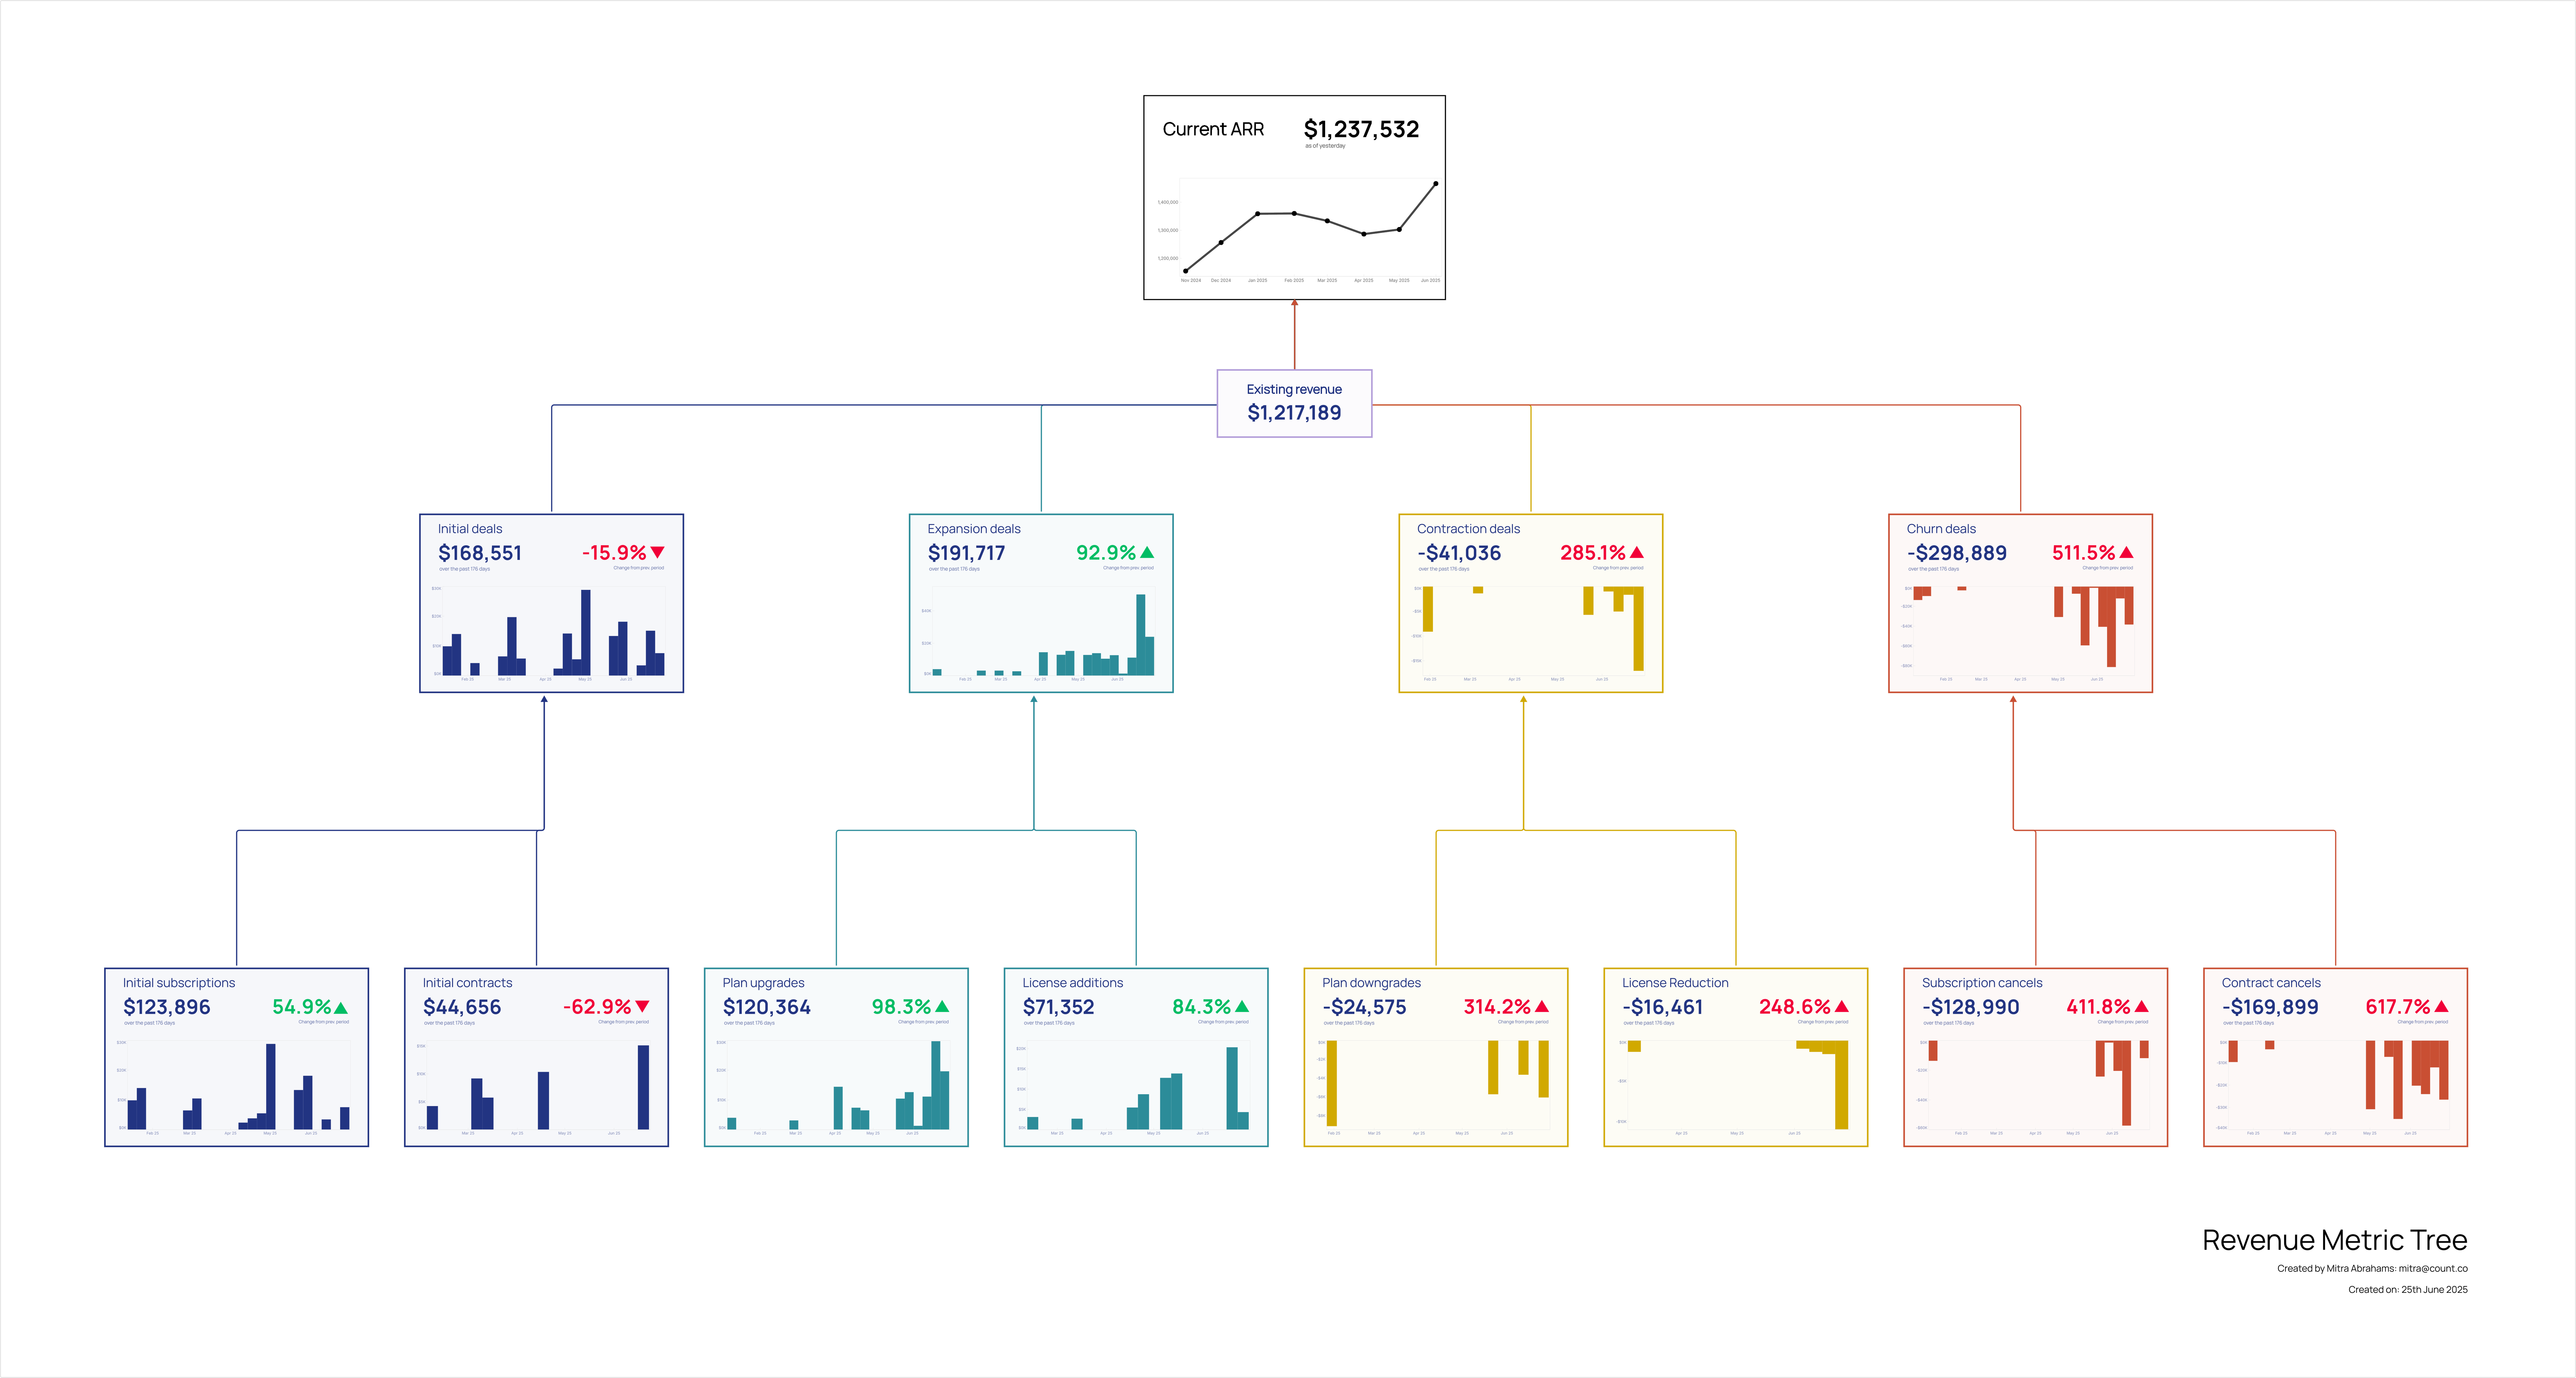
Your GA4 Data Knows Where Your Leads Come From. You Just Can't See It.

Someone from your board just asked: "Which traffic sources are actually generating qualified leads?"

And you... opened GA4. Clicked through Acquisition. Then Engagement. Then Conversions. Switched to a custom exploration. Lost the thread. Started over. Pulled up that Looker Studio dashboard someone built six months ago. Squinted at a table with 47 rows of UTM parameters.

Thirty minutes later, you have a partial answer and a headache.

The data exists. GA4 is tracking every session, every source, every page view, every conversion event. But connecting "organic social" to "demo request" to "actual qualified lead" requires flipping through multiple reports, remembering the difference between sessions and engaged sessions (seriously, does anyone actually know?), and holding half the analysis in your head while you hunt for the other half.

Ready to explore this canvas with your own data?

Try this canvas →