Your Company Has No Idea Where ARR Actually Comes From
Your CEO asks in the leadership meeting: "ARR grew $120K last quarter. Great. But where did that come from?"
Someone says: "New deals."
Someone else says: "I think expansion too."
Your CFO starts pulling up spreadsheets. Check Stripe for subscription data. Pull HubSpot for contract deals. Cross-reference with that manual tracking sheet for upgrades and downgrades. Add up cancellations. Subtract contractions.
Twenty minutes later: "Looks like $180K from new business, $60K from expansion, minus $90K from churn and $30K from downgrades. So net $120K."
Everyone nods. Meeting continues.
But here's what nobody asked: Is that new business mostly subscriptions or contracts? Is expansion coming from plan upgrades or license additions? Are we losing more to downgrades or outright cancellations? Which components are trending up or down?
Your ARR number exists. The breakdown? That requires manual archaeology every time someone asks.
The ARR Black Box Problem
Most companies track ARR. It's the number. The metric that matters. You know what it is right now. You know what it was last quarter.
But understanding how you got there? That's different.
ARR is not a monolith. It's a composition:
- Initial deals: New subscriptions and new contracts bringing fresh ARR
- Expansion: Existing customers upgrading plans or adding licenses
- Contraction: Customers downgrading or reducing licenses
- Churn: Subscription cancels and contract cancels taking ARR away
Each component tells a different story. High churn means retention problems. Strong expansion means your product has pricing power. Contraction creeping up might signal product-market fit issues in certain segments.
But these components live scattered across systems. Your subscription data lives in Stripe or Chargebee. Your contract deals live in HubSpot or Salesforce. Upgrades might be tracked manually. Downgrades might be... somewhere. Churn gets calculated retrospectively when finance does month-end close.
So when leadership asks "where is our ARR coming from?" you're manually stitching together data from four places. And when they ask "how does this month compare to last quarter?" you're rebuilding historical calculations from scratch.
Your finance team knows the full picture. Maybe. If they have time to compile it. But the rest of the company? They just see the top-line number. Sales doesn't know if their new business is being offset by silent churn. Customer Success doesn't see contraction trends until it's too late. Product doesn't realize expansion has stalled.
Everyone's making decisions with one-tenth of the information.
What If Your Entire Company Could See The ARR Story?
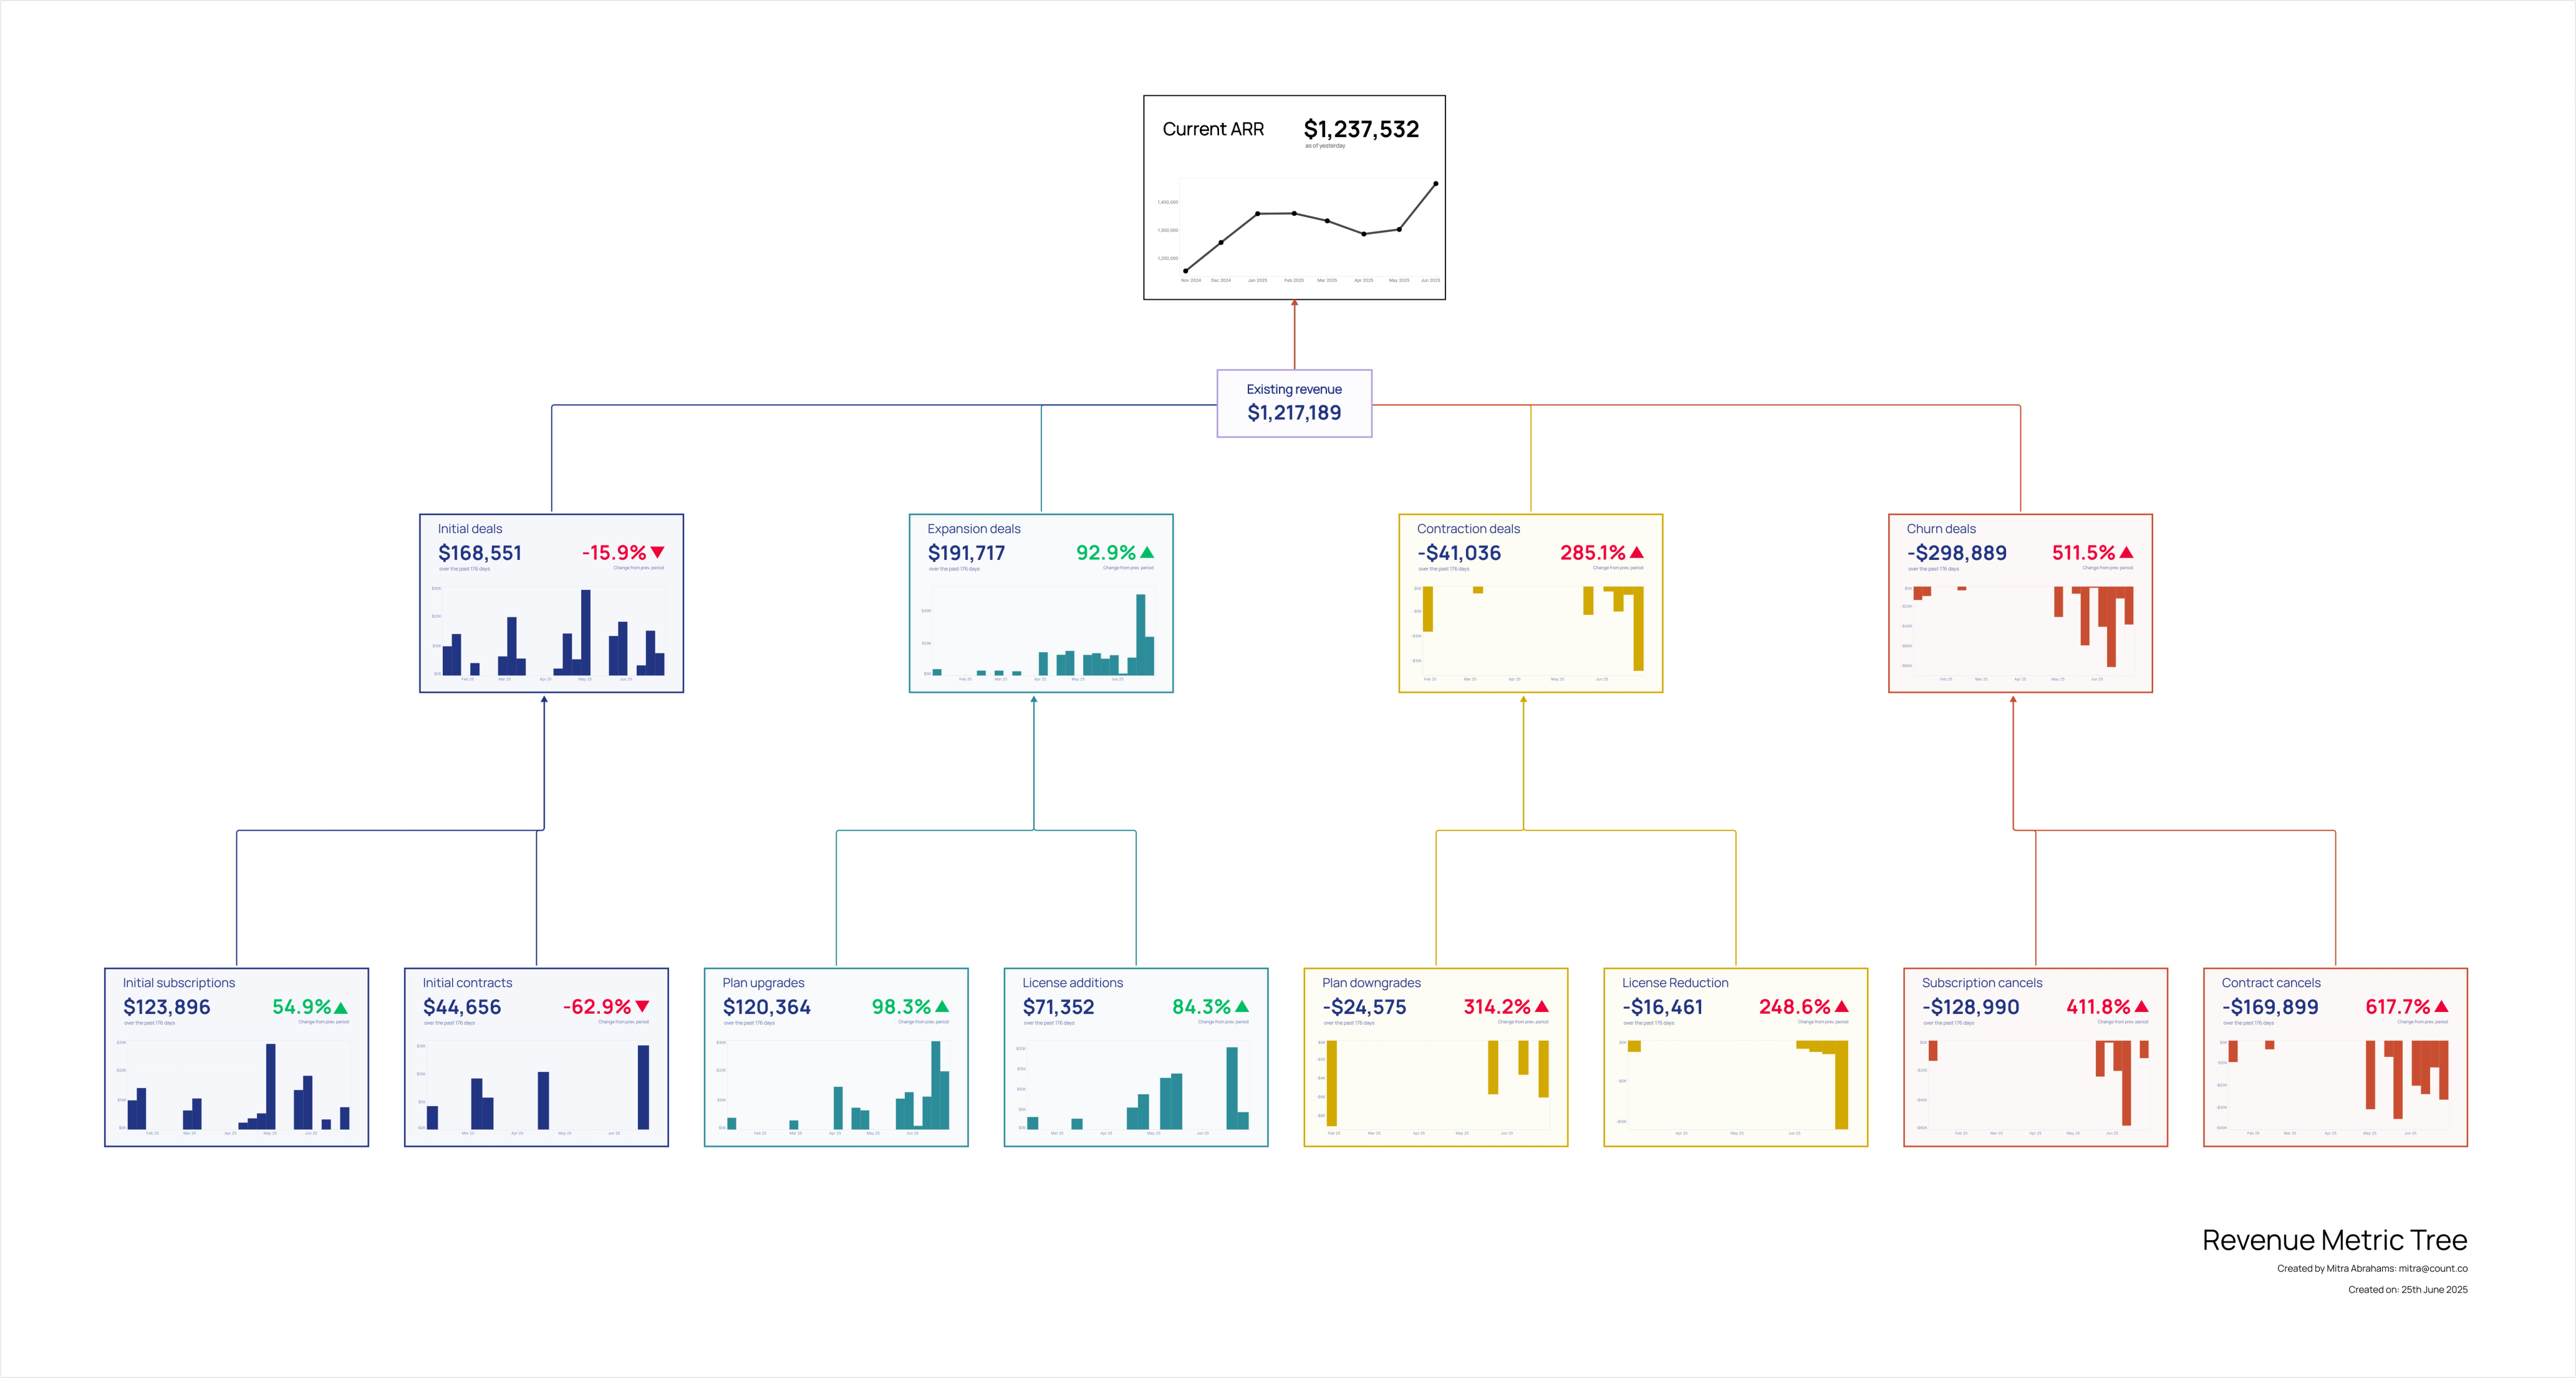
Count's simplified revenue metric tree shows current ARR broken down into components—live from your data warehouse.
Top level: Current ARR. The number everyone cares about.
Second level: The four components that drive it. Initial deals (new subscriptions + new contracts). Expansion (plan upgrades + license additions). Contraction (downgrades + license reductions). Churn deals (subscription cancels + contract cancels).
Each component showing current values. Not just this month, but trends. Is expansion accelerating? Is contraction becoming a bigger problem? Is churn concentrated in subscriptions or contracts?
Which is a fancy way of saying: everyone can finally understand where your ARR actually comes from without asking finance to rebuild a spreadsheet.
This is pulled from your data warehouse—Stripe, your CRM, subscription management tools, wherever your revenue data lives. Most companies don't have this unified, so they're manually calculating across sources every time they need the picture. Build it once, see it always.
Your CRO sees that new deal ARR is strong but expansion has flatlined for three months. Time to focus on upsells. Your Customer Success lead spots contraction trending up—downgrades are becoming a pattern, not anomalies. Your CEO gets asked about growth by the board and can actually explain it: "$200K from new business, $80K from expansion, offset by $140K from churn and $20K from downgrades. Net new ARR: $120K. Here's the trend."
And because it's a canvas, your team can collaborate. Your sales lead drops a comment on the churn number: "Most of this is legacy contracts from 2023—expected." Your CS team adds context to contraction: "Three downgrades from customers who outgrew our mid-tier but aren't ready for enterprise—pricing gap issue."
High-level visibility. Live data. Company-wide understanding.
Done.
From Quarterly Reports to Daily Transparency
Here's what changes when your ARR breakdown is visible:
Leadership makes faster decisions. No more waiting for finance to compile the numbers. The ARR story is always current, always accessible.
Teams spot problems early. Churn accelerating? Expansion stalling? Contraction becoming a trend? You see it now, not three months from now during QBR.
The company gets aligned. When everyone understands where revenue comes from—and where it's leaking—they make better decisions. Sales focuses on the right deals. CS prioritizes retention. Product builds for expansion.
The reality is: ARR is simple in concept. New business grows it. Expansion grows it. Contraction shrinks it. Churn shrinks it. That's the whole story.
But most companies can't tell that story without manual work. The components live in different systems. The calculations happen in spreadsheets. The visibility stays locked in finance.
Build your simplified revenue metric tree once. Connect it to your data warehouse. Show current ARR and the four components driving it. And finally give your entire company the high-level view they need to understand where your revenue actually comes from.
