Next Webinar →Count Shipped: May 26 | 27 MAY
Back to gallery

Finance Health Metric Map

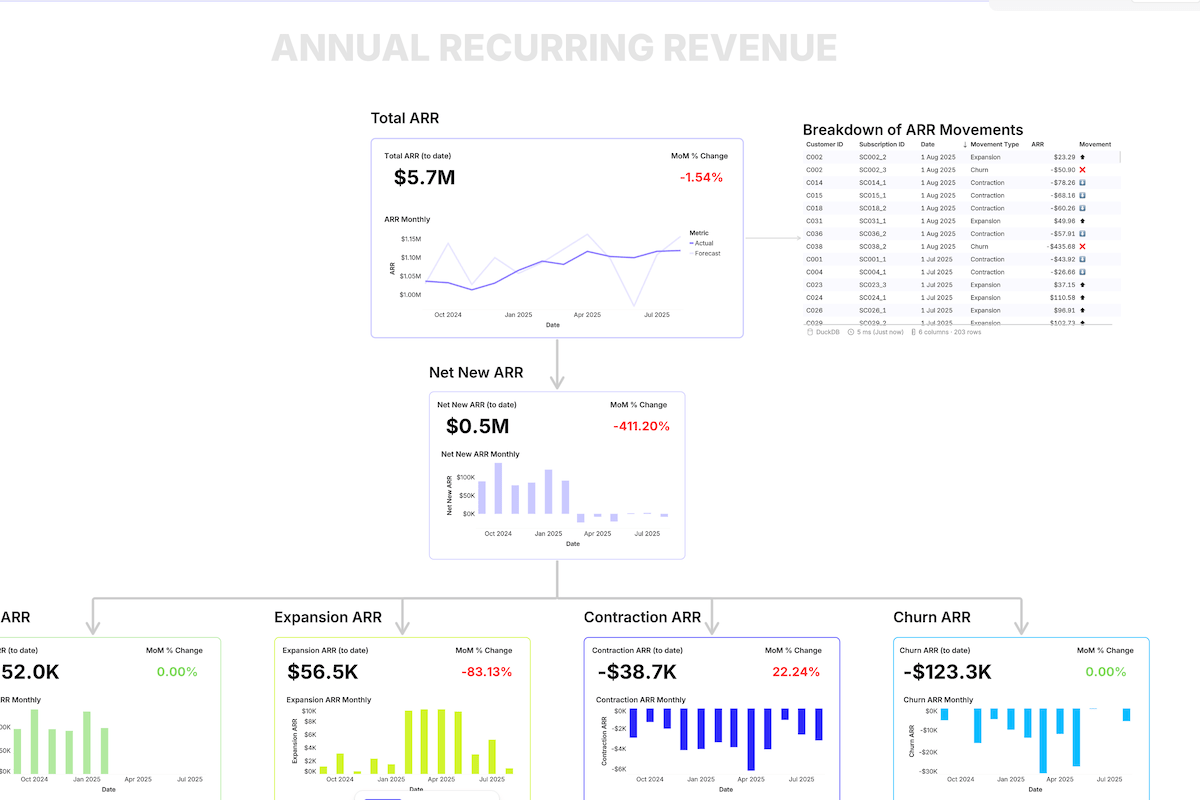
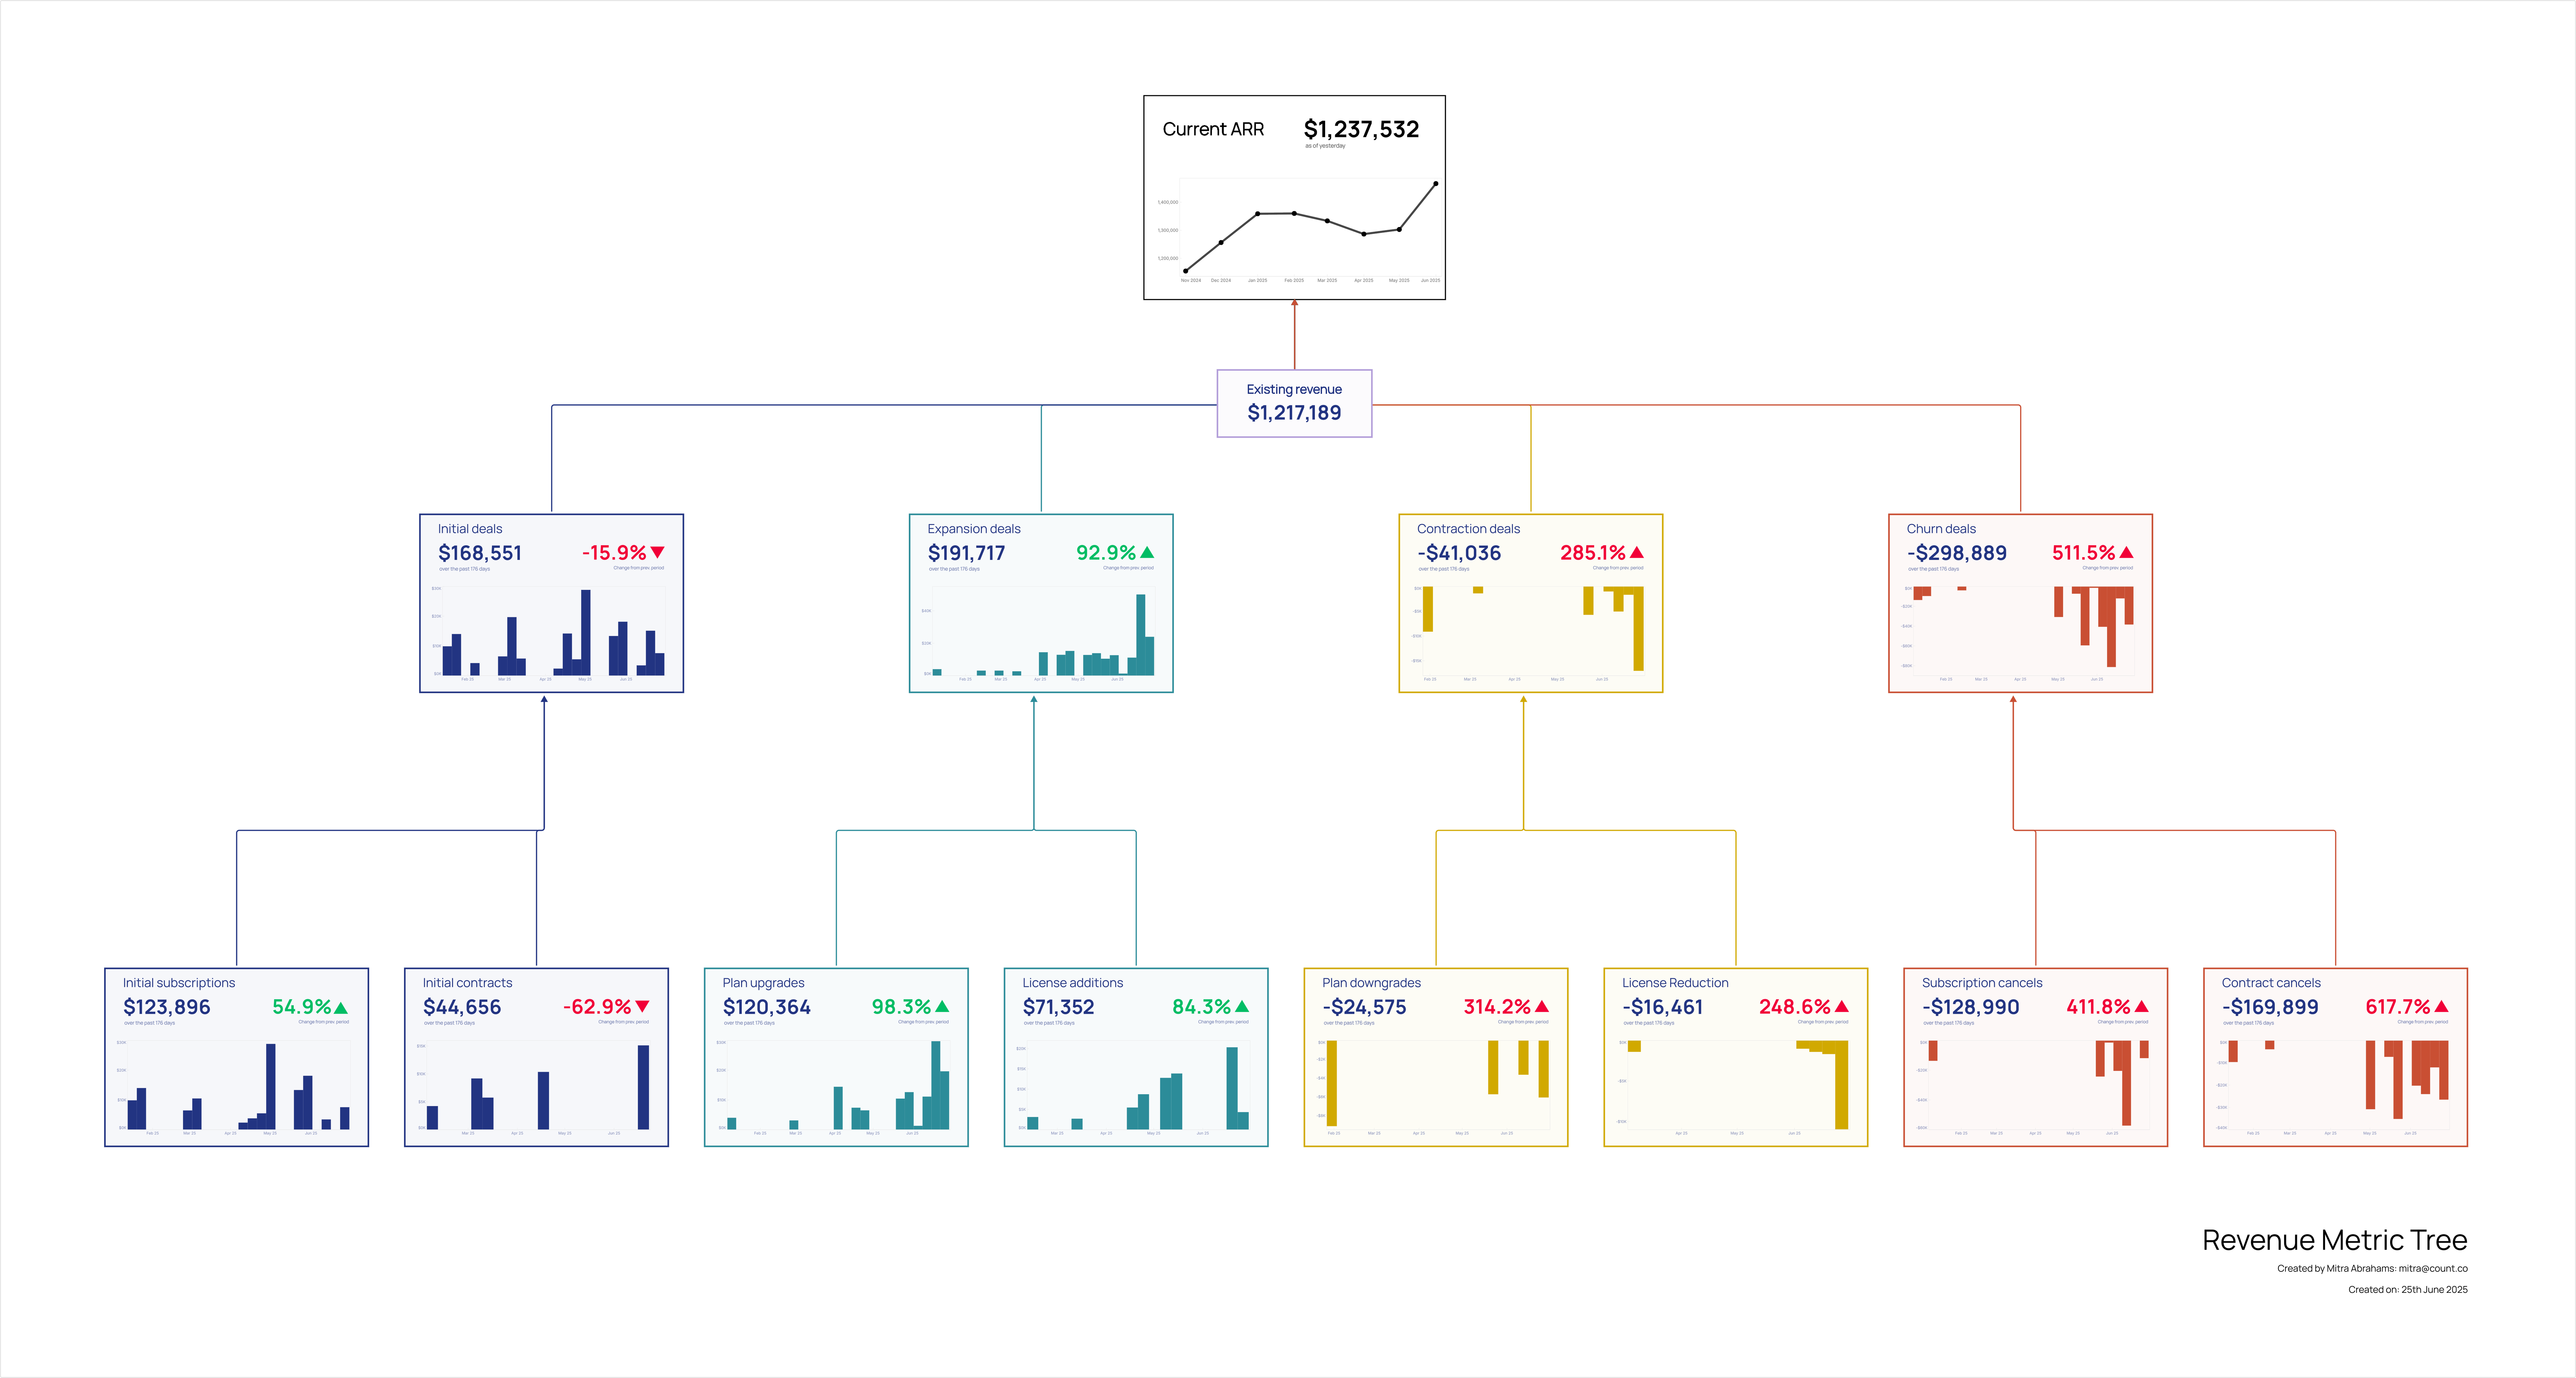
Unified finance canvas to track ARR, deals, and payments in one place to monitor, prevent issues, and enable decisions.

Try this canvas
Finance Health Metric Map

Problem

Finance metrics can be scattered across multiple dashboards and systems, making comprehensive monitoring and analysis difficult.

Solution

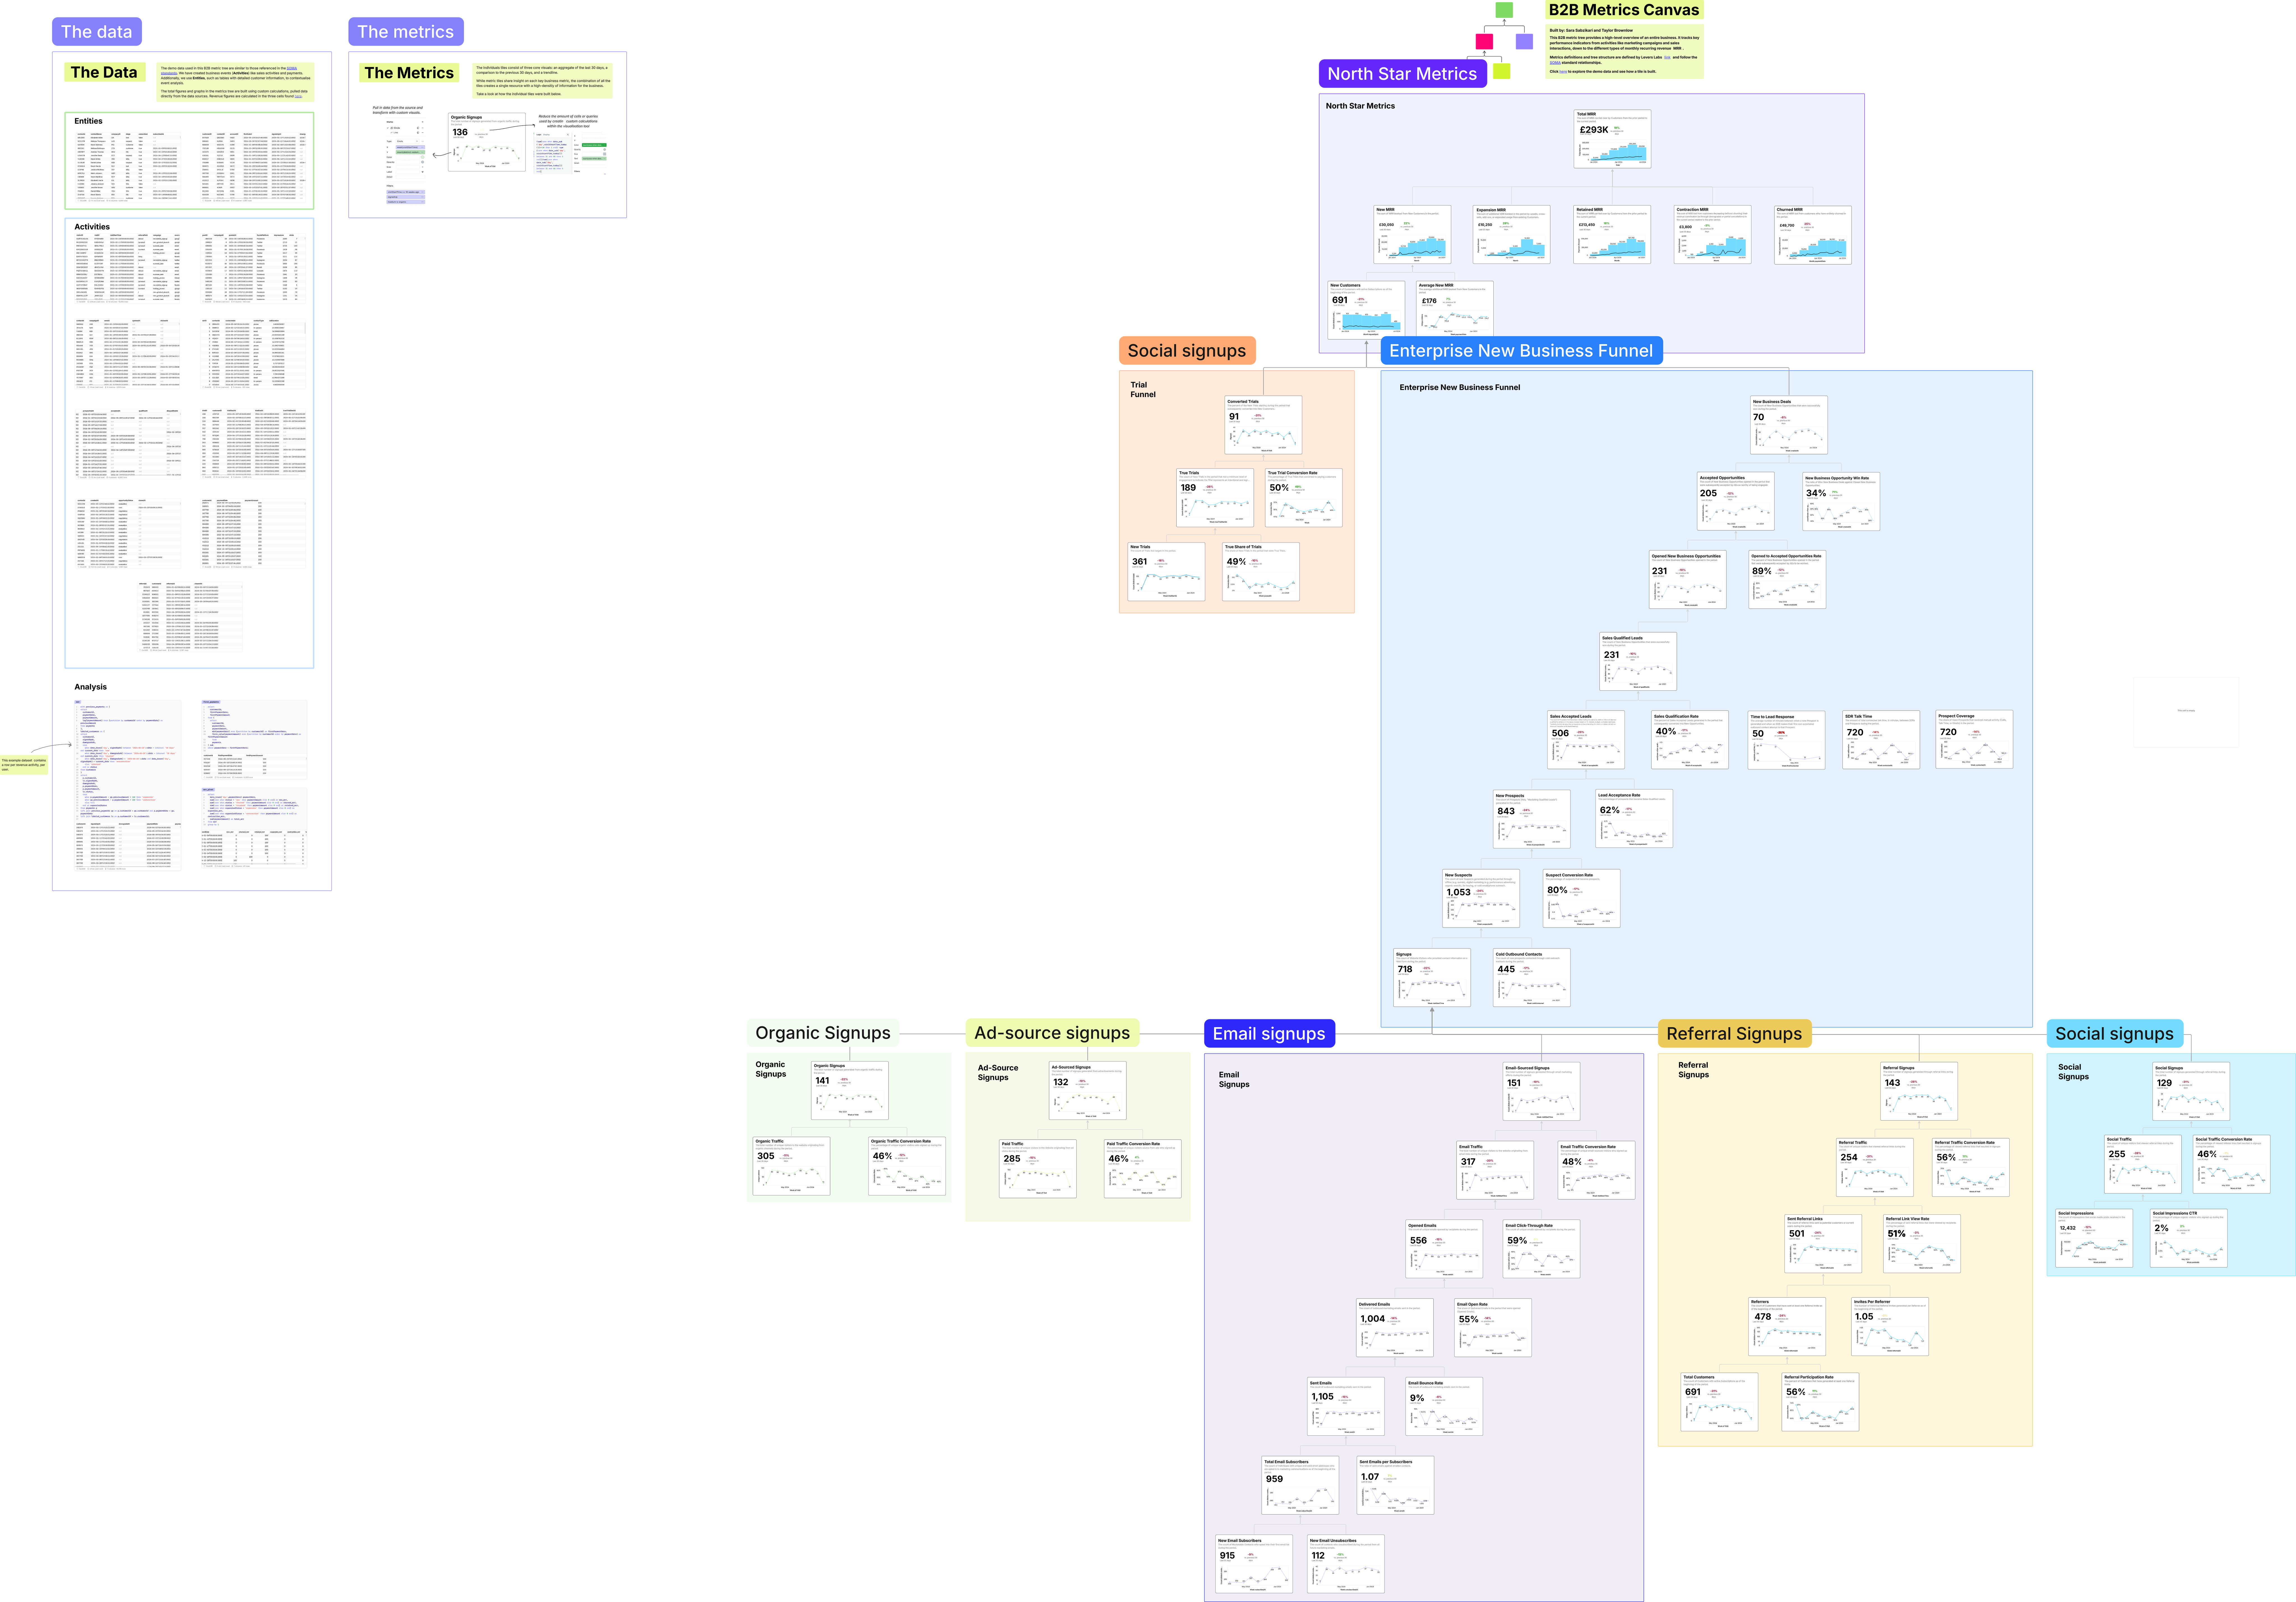
Combine all your datapoints within a single canvas, visualizing metric trees, dashboards, charts and line-level table data for a complete finance view.

Impact

Benefit from detailed analysis for teams, high-level visuals for executives, and use comments and instant alerts to raise and prevent issues.
"What's Our ARR?" Should Not Be a 3-Hour Research Project

Your board meeting is tomorrow. Your investor asks a simple question: "What's your ARR right now, and how does it compare to last quarter?"

You open Stripe. Then HubSpot. Then Xero. Then that spreadsheet your finance analyst maintains. The numbers... don't quite match. Stripe shows payment volume. HubSpot shows bookings. Xero shows revenue recognition. Your spreadsheet shows something in between.

So you do what every finance team does: manually reconcile. Pull closed deals from HubSpot. Cross-reference with Stripe payments. Check Xero for revenue recognition timing. Adjust for that enterprise customer who paid annually versus monthly subscribers. Account for expansions. Back out churned accounts. Factor in failed payments that haven't processed yet.

Ready to explore this canvas with your own data?

Try this canvas →