Going deeper into startup metrics
Written by The Count Team
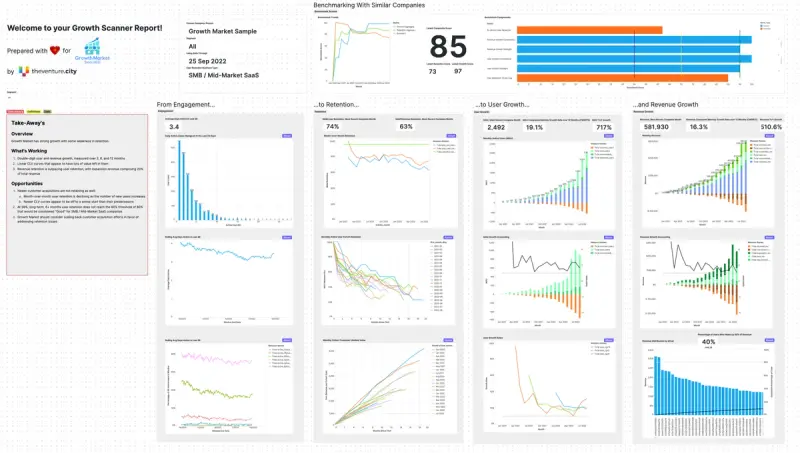
Unlock startup growth with Growth Scanner—TheVentureCity's interactive tool for data-driven scaling decisions. Collaborate seamlessly with Count's dynamic canvas.
David Smith, Head of Data & Analytics at TheVentureCity, is a longstanding Count superfan. David uses the Count canvas to analyze and manage TheVentureCity’s portfolio of early-stage startups - including Count itself. He spoke with Count Chief Evangelist Mico Yuk about Growth Scanner, the new interactive tool from TheVentureCity that helps startups make data-informed decisions about when and how to scale.
It all started with David and TheVentureCity’s desire to tackle one of the biggest challenges for founding teams - figuring out exactly what they should work on next. Before Growth Scanner, there was no common framework for evaluating how well a startup is doing.
‘It was very hard to answer fundamental questions - do I have product market fit and how strong are those signals? Do I have a leaky bucket? Is it time to scale? There just isn’t anything in the startup space like GAAP for enterprise firms. That’s what we set out to fix.’
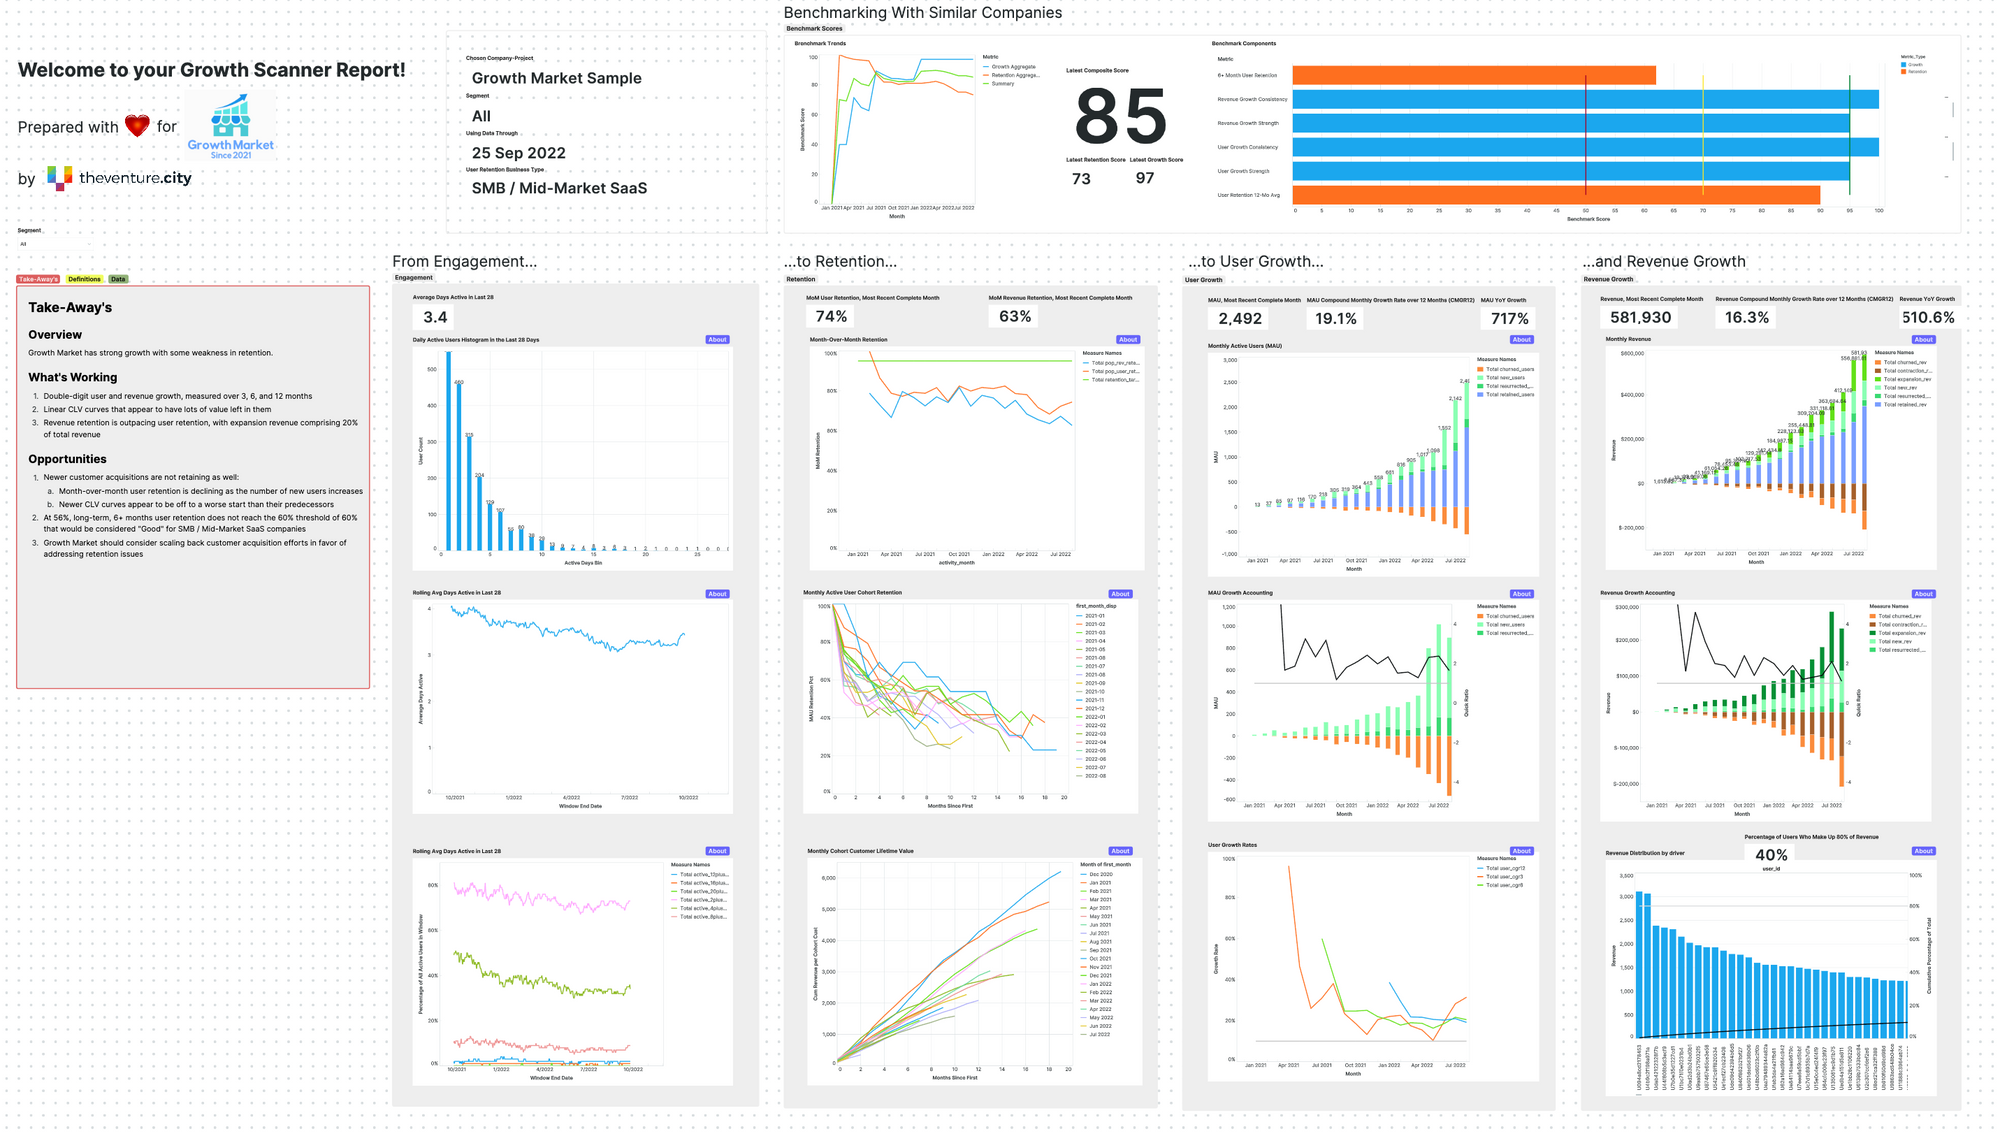
Any startup can easily see where they stand and compare themselves to similar companies using TheVentureCity’s metrics.
‘Our benchmarking fits you in amongst your peers. What is good retention or engagement? It’s different for B2B Saas vs Fintech. We compare apples to apples.’
After many tries on other tools, Growth Scanner emerged as an interactive data app built on Count.
‘Before we were using Redash, which is good for basic charts. But we can’t add comments, draw, point things out - all the things you’d do if you were having a conversation with someone. We were stuck doing everything through zoom. It’s just so much easier through the canvas to work together and call out what really matters.’
Discussing what really matters is at the heart of both Count and Growth Scanner. TheVentureCity data team uses Count to have real data conversations with the business instead of just tossing charts over the wall.
‘If you have a particular question you’re trying to answer try a collab between a SQL person in the data and the business person. Bring them together and good things happen vs building a traditional dashboard.
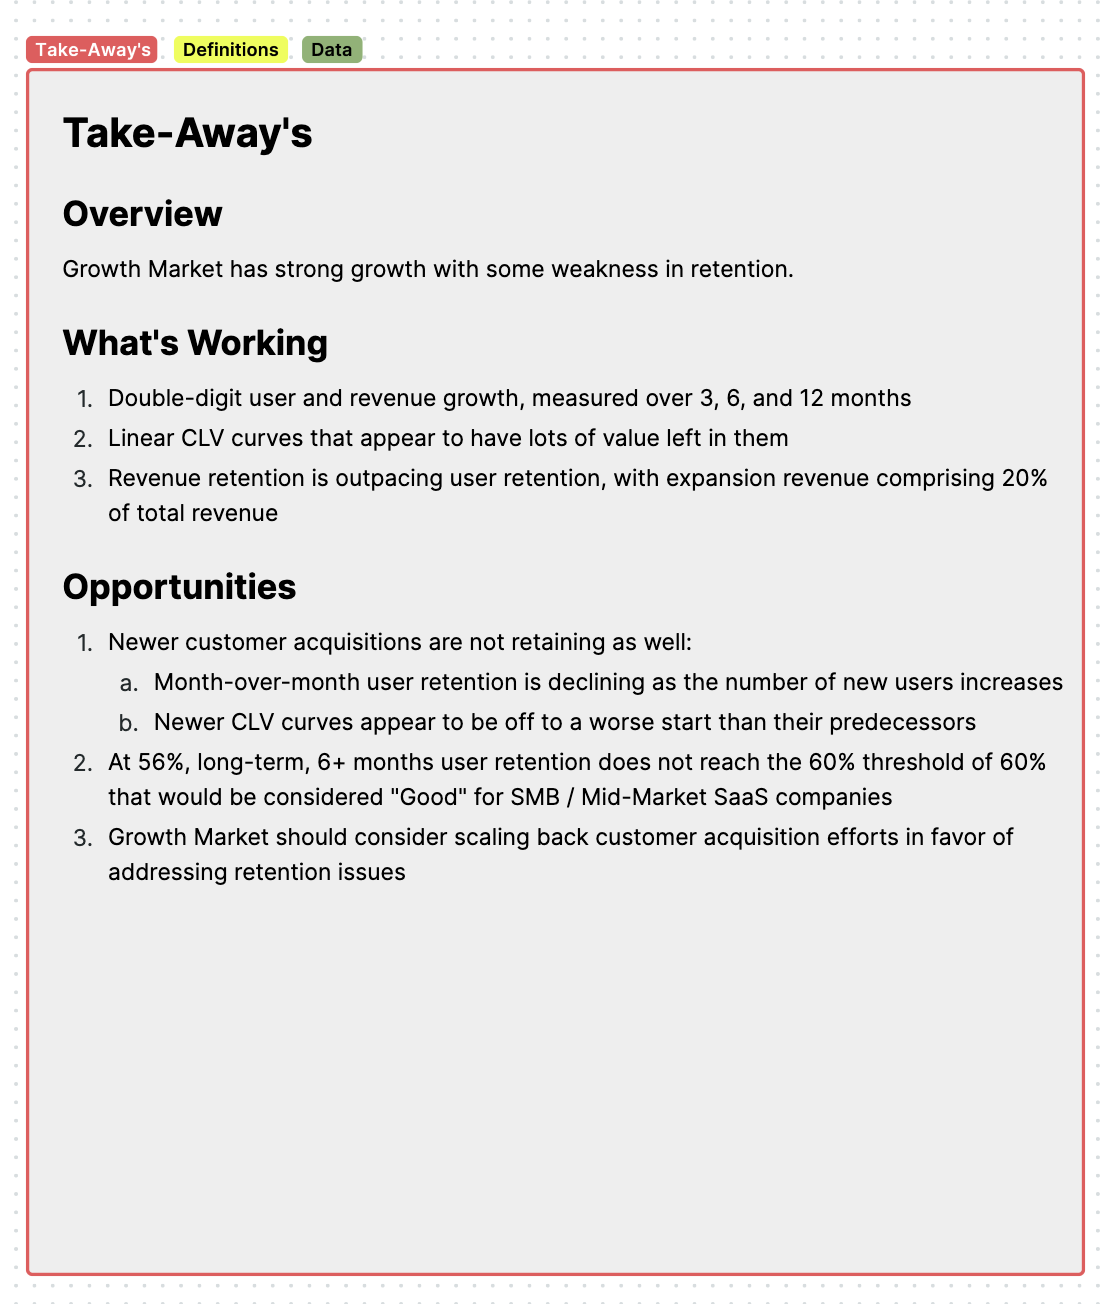
As far as how to get started, David argues that the Count canvas is such a new tool and so out of the ordinary, people need to change the way they think. ‘This isn’t just a dashboard, it’s a two-way conversation where you can zoom and pan and leave comments. Use it, understand it - make chart descriptions, leave annotations. There’s so much more information than in a traditional presentation, take advantage of it. If you don’t understand something, just leave a comment and you’ll get a comment back. The two-way communication is game-changing.’
‘We’ve done 150 growth scanners over the years, and the last 20 are in canvas. We’ve been doing it for years but we weren’t able to turn it into a really useful product until we had the canvas. The sharing at the canvas level, the talking back and forth - it just changed the game for us.’