Folders and new ways of presenting
Written by The Count Team
Organize projects with new folders, present reports in slides or scrollable views, and group fields in Count Metrics for better data management.
We've introducedfoldersin Count, letting you organize your projects in new ways, better seperate project phases, production/WIP, or just clear the decks of the "Untitled" that build up over time.
That's not just me, right? 😬
This has been a standing feature request from some of our larger users where projects quickly balloon and organization is key.
The folders you create are available for use right across the app, so whether you are starting a new project, or looking to save an Explore-mode visualization, you'll be able to file it exactly where it belongs.
wistia-player[media-id='y6en6c52wn']:not(:defined) { background: center / contain no-repeat url('https://fast.wistia.com/embed/medias/y6en6c52wn/swatch'); display: block; filter: blur(5px); padding-top:56.25%; }
Presenting reports and slides
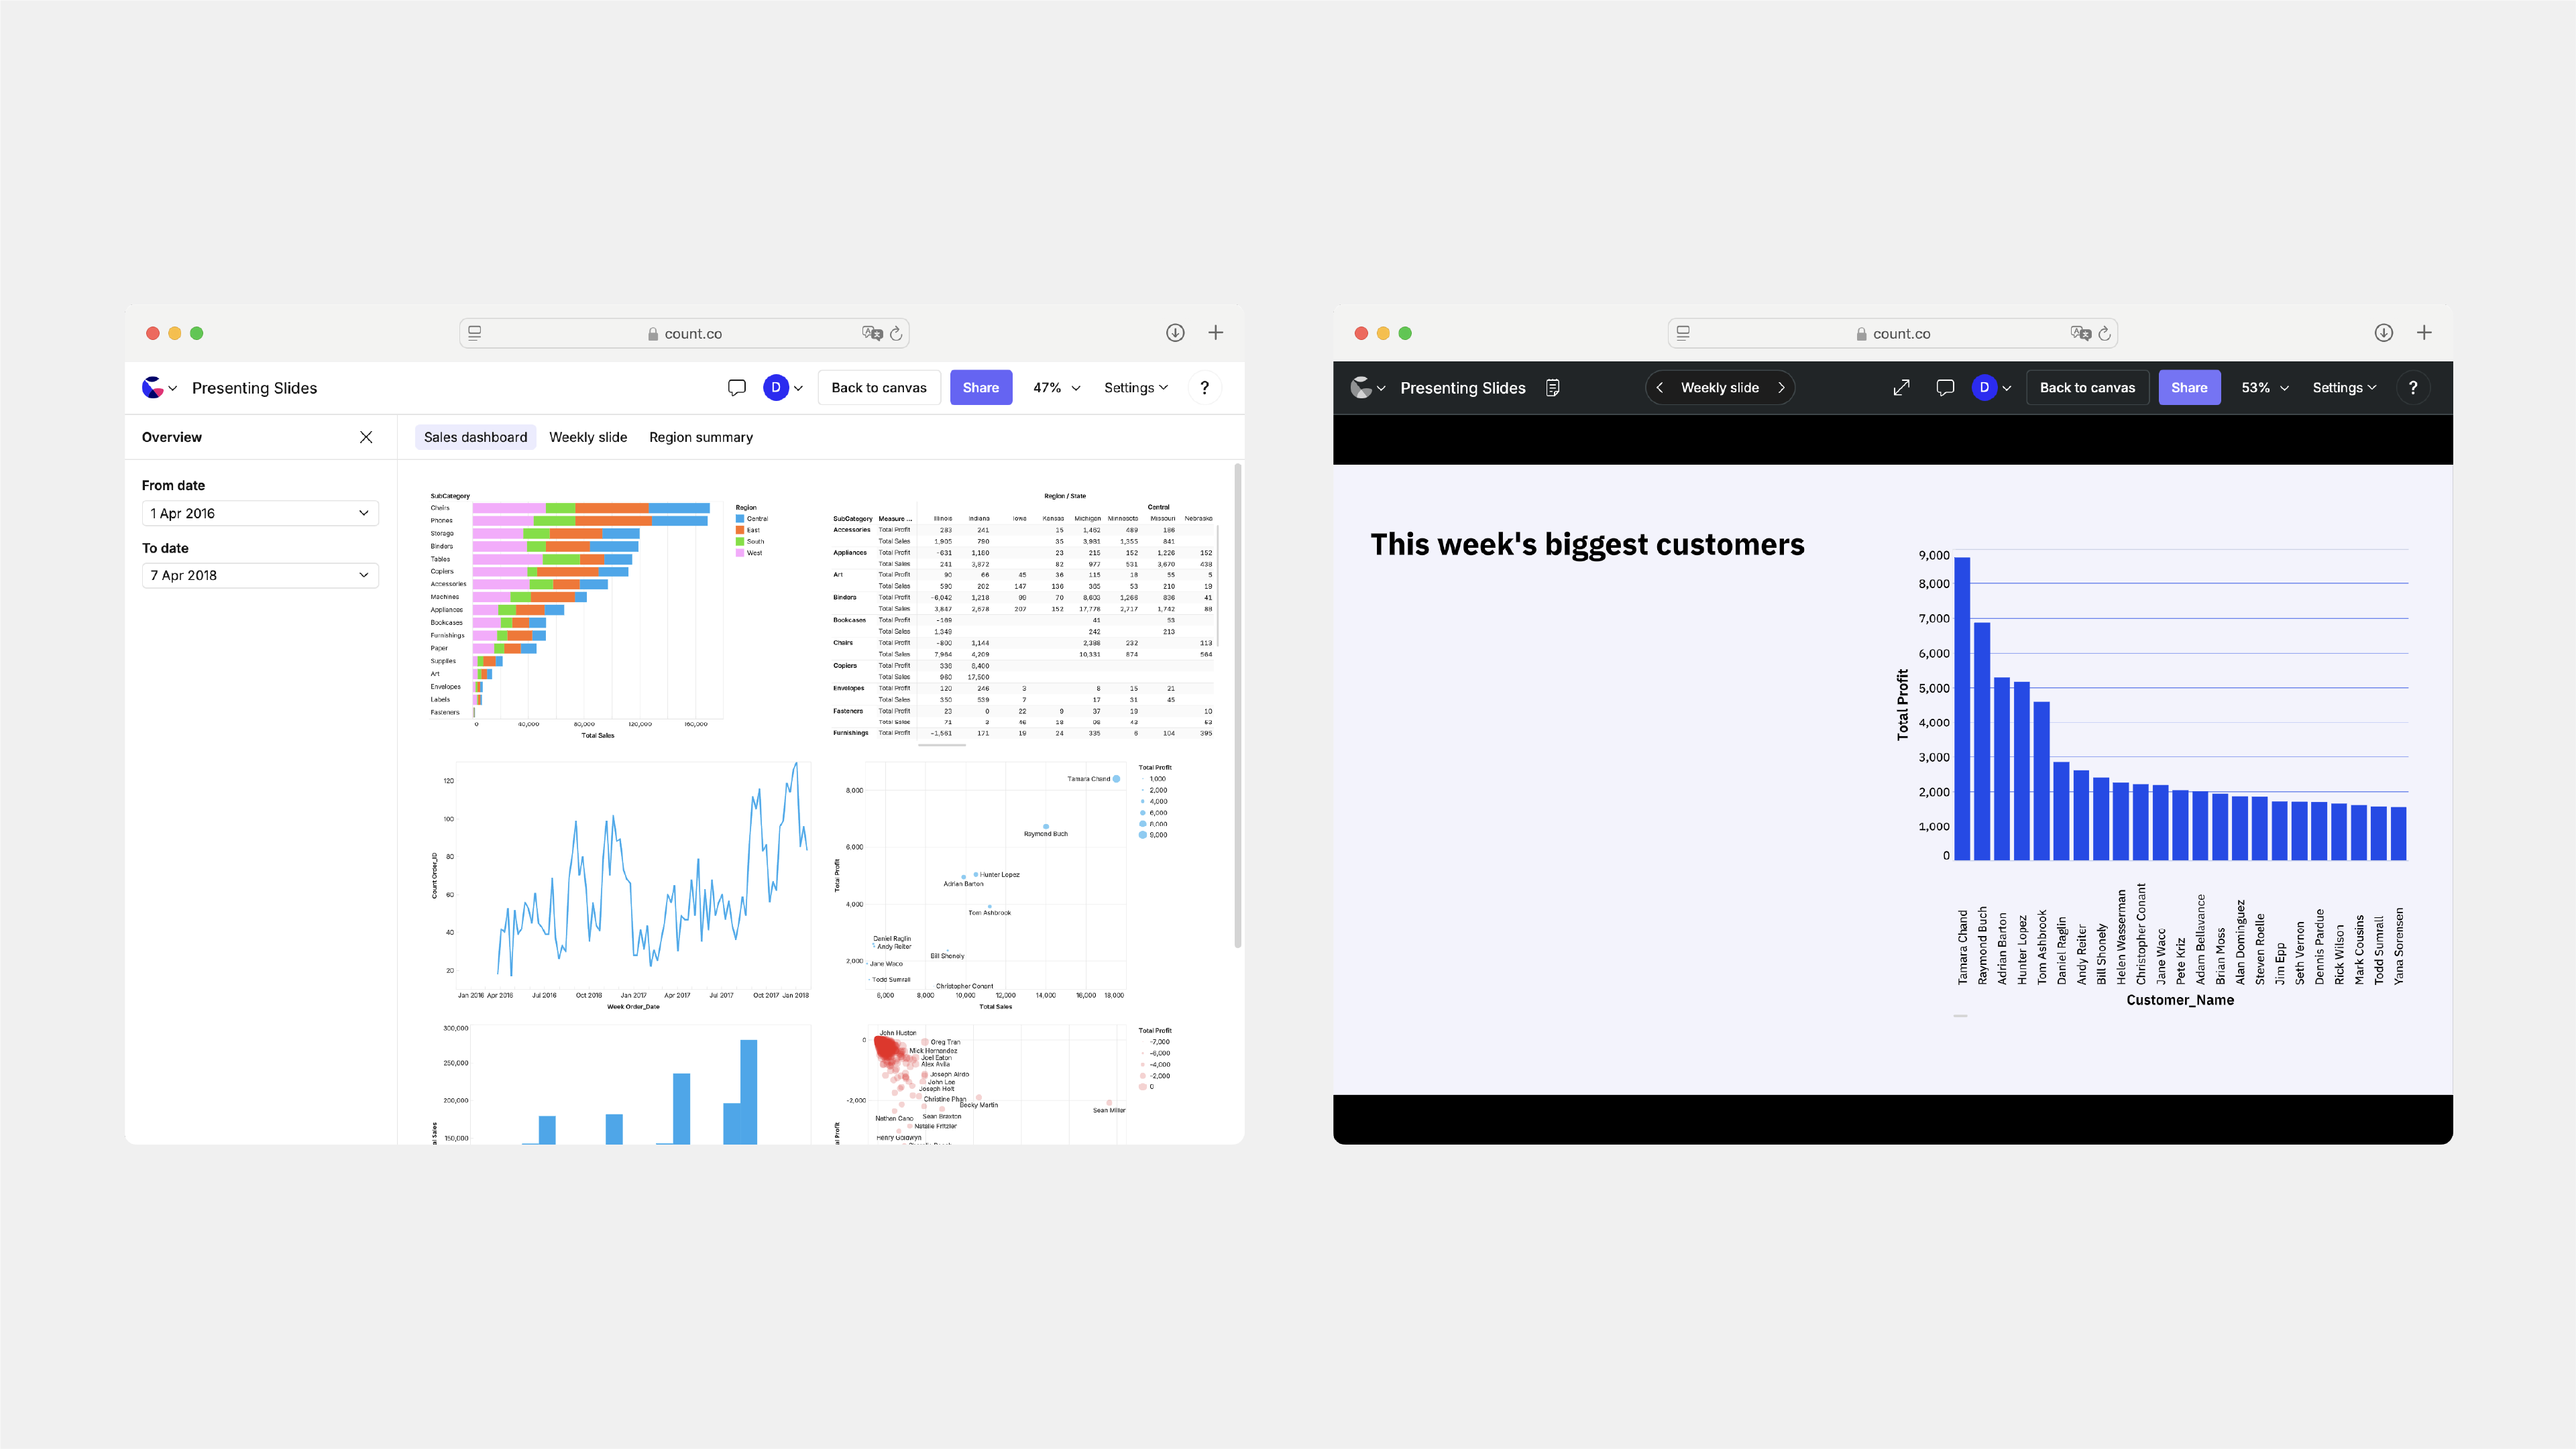
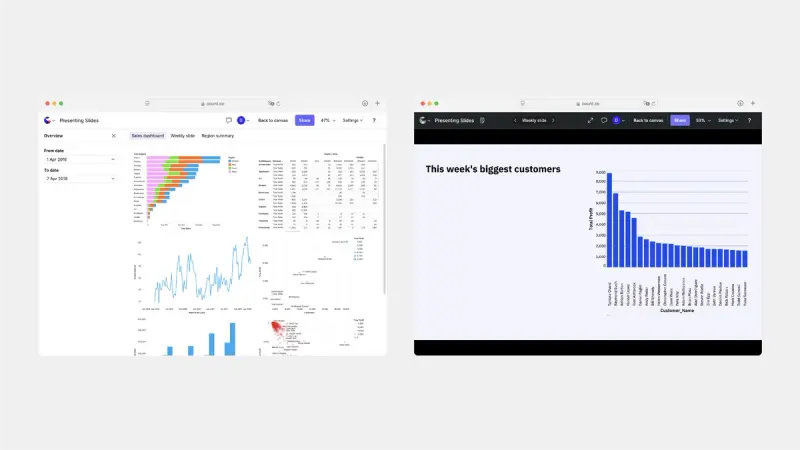
Alongside this, we've introduced a fairly large conceptual change: the "report" button is no more.
Customers told us that they needed more flexibility in laying out reports in order to better serve stakeholders and to help them migrate existing reports away from legacy tools. To help, we've split our existing report functionality into two distinct modes:
- - A new default scrollable view, that is closer to what stakeholders expect when they here the word report. With a new top navigation bar, and our exiting, this dramatically increases the flexibility in how you share data across the organization.
- - The prior behaviour, optimized for showing frames full-width with minimal Count UI. We've leant in further here and introduced abutton to make it even easier to create and share slideware in Count, or create live rotating dashboards and information radiators on any display with a web browser.
Organizing Count Metrics Catalogs With Groups
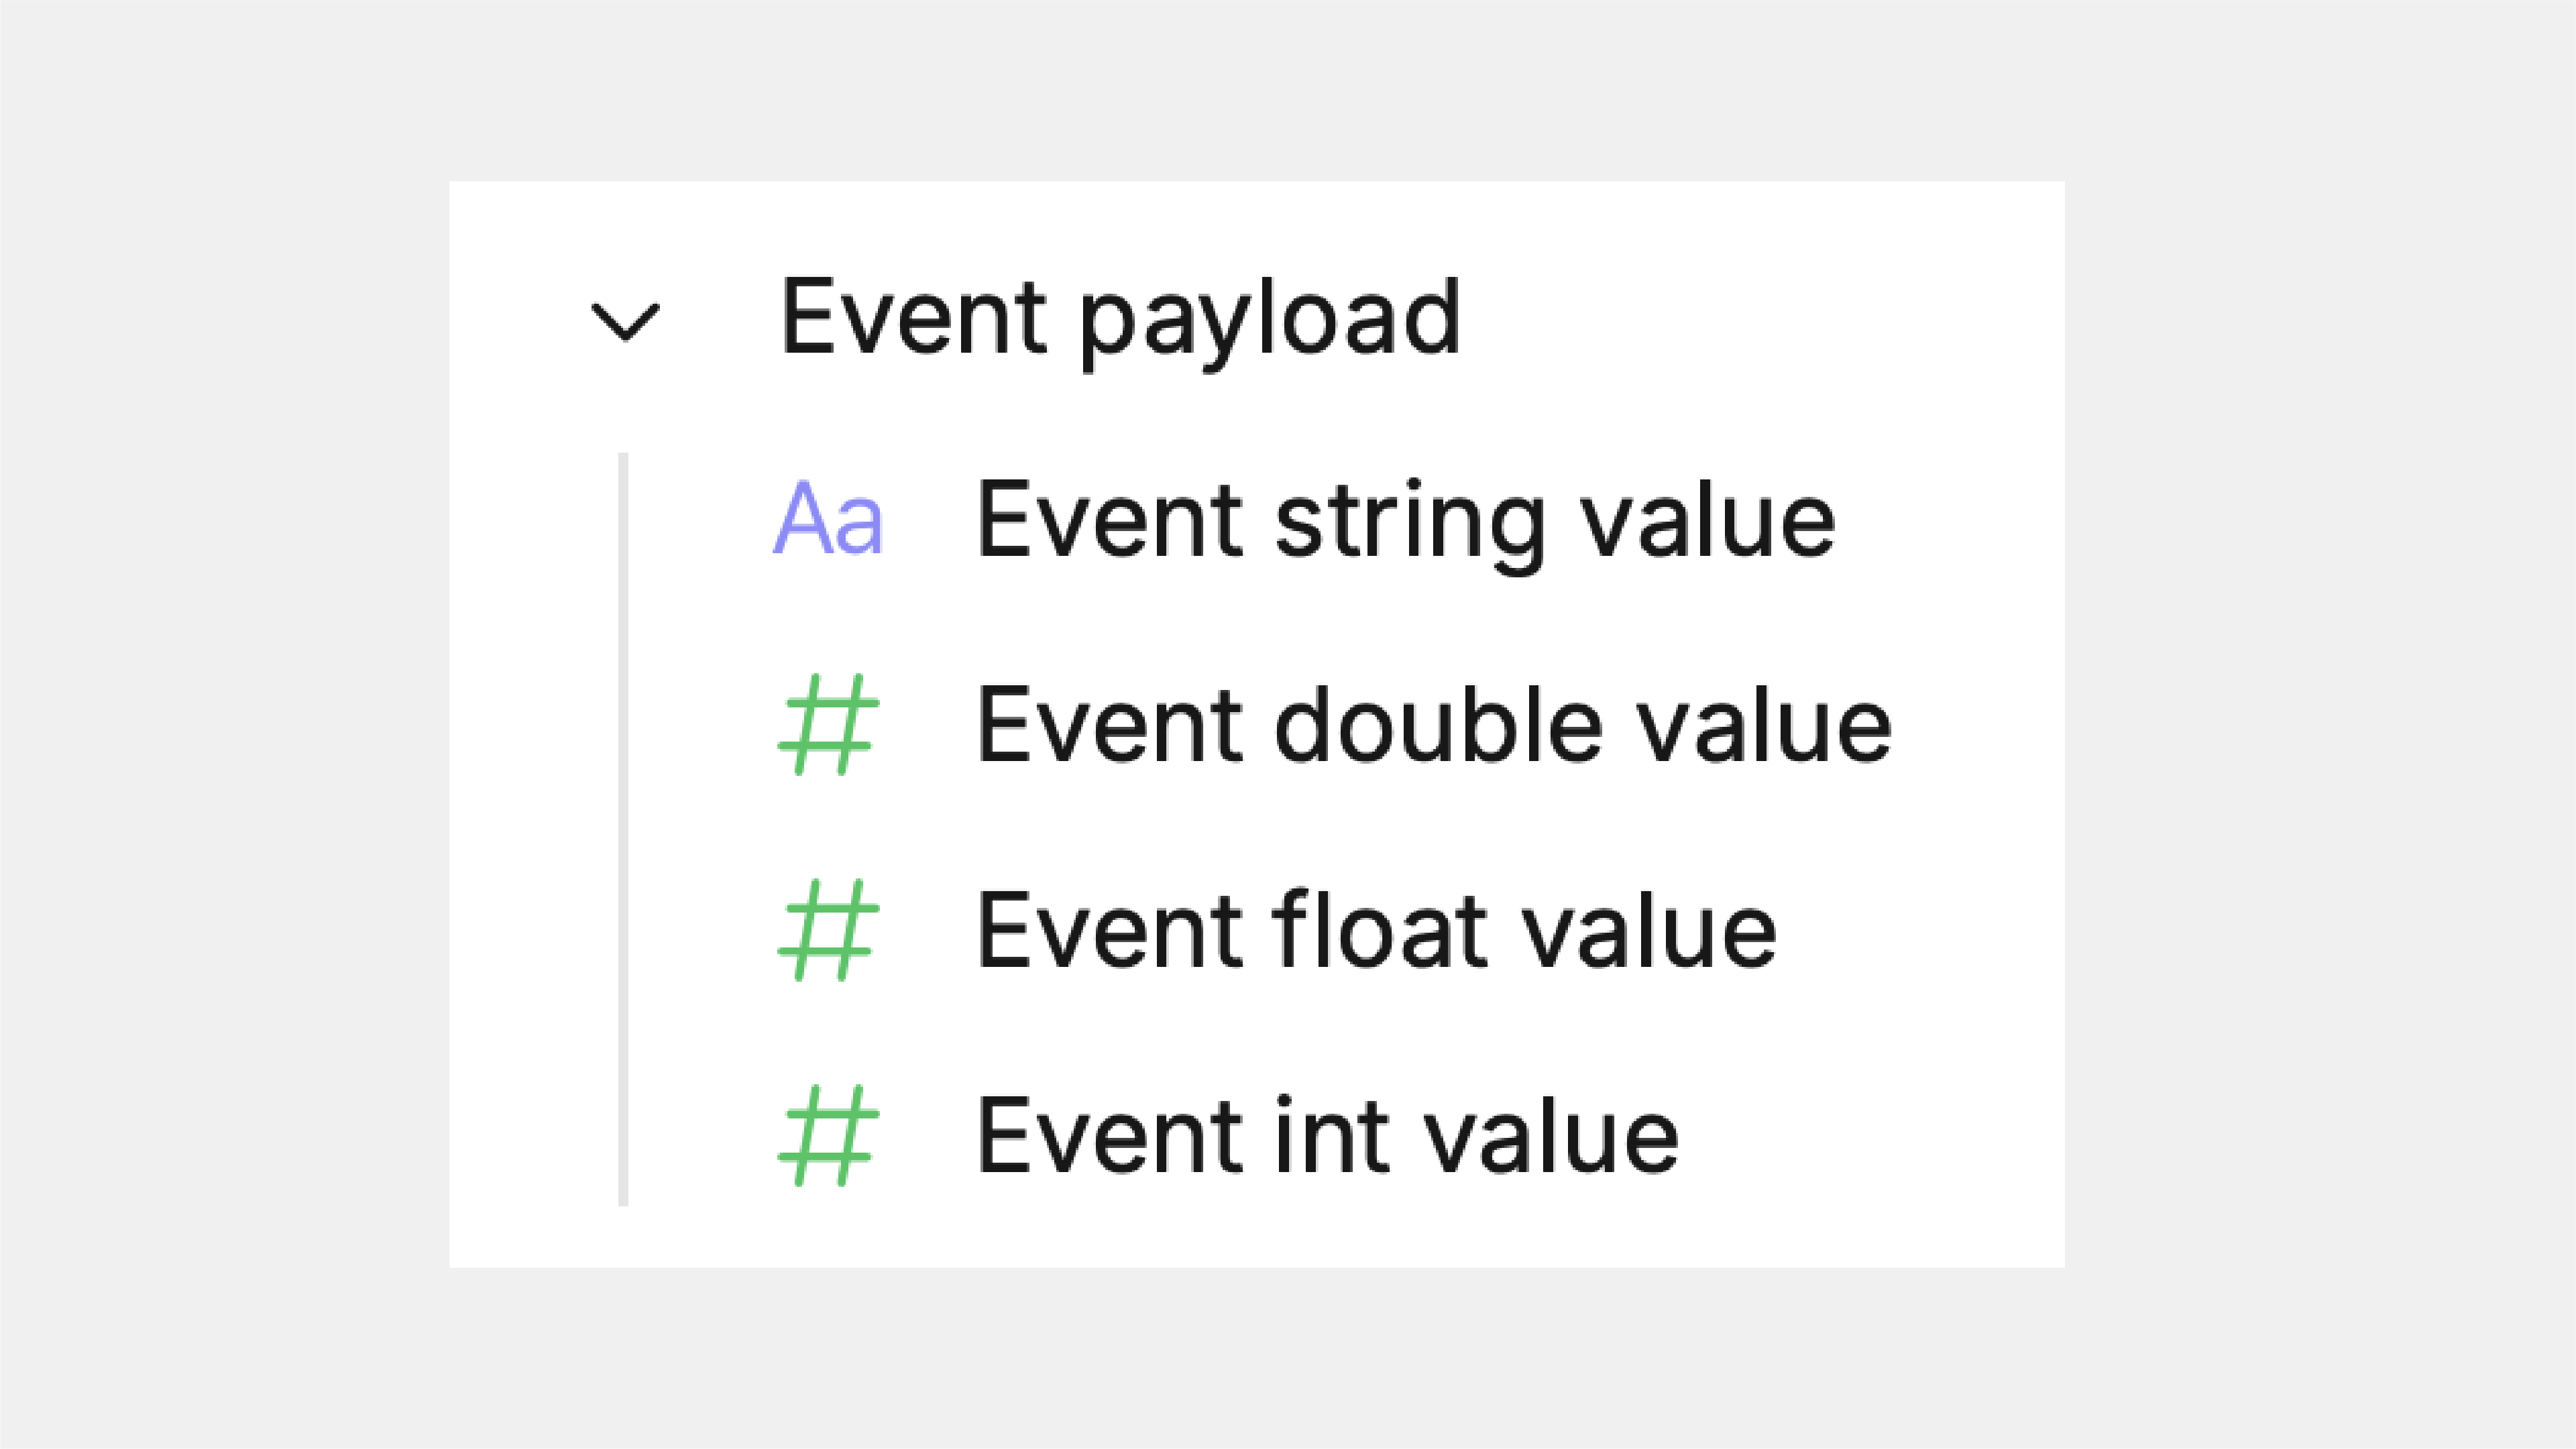
As we continue to evolveCount Metricswe've made it easier to create highly usable catalogs by introducing grouping to fields.
Akey can now be added toview fieldswhich will place them within an expandable list similar to that currently used for aggregations.
We're constantly making iterative improvements and fixes to Count. You can keep up to date on ourchangelog.