The Whale: Why We Mapped AI Startups as Schools of Fish
Written by The Count Team
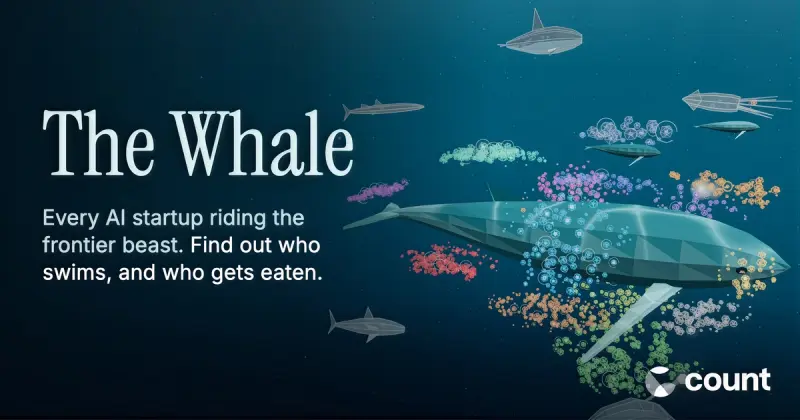
Explore The Whale, a 3D map of 1,471 AI startups and 261 acquisitions, where schools of fish reveal the industry’s power dynamics—and who’s getting swallowed.
The AI industry has a shape, and spreadsheets don't show it. A few frontier labs and big tech companies sit at the center. Everyone else swims around them, feeding off their models, racing them to market, and sometimes getting swallowed. We wanted a picture of that, so we built one: The Whale, a 3D map of 1,471 AI startups and the 261 that have been eaten since 2023.
Why a whale
At Count, we spend our days on a narrow question: when AI gets something wrong, who catches it? That question made us curious about the industry itself. How many companies are building AI, how many are building ways to check it, and who is buying whom.
The answer turned out to need a metaphor. The frontier labs are enormous, and the rest of the ecosystem genuinely depends on them. A food chain, with a whale at the top of it. Startups are fish. They move in schools, grouped by what they do: developer tools, data and search, creative media, security, healthcare, and so on. When one is acquired, you see it get eaten, and the predator grows.
Only 65 of the 1,471 companies on the map, about 1 in 23, are building tools to check whether AI is right. That's the cluster we're in, alongside companies like Pangram and SymbyAI. It's small. The map shows how small.
Where it came from
The Whale started as a working session with Crunchbase exports. We were pulling lists of Series A to C AI startups across the US and Europe to understand the market, and the same picture kept appearing in the data. Survival is hard, the acquirers keep getting bigger, and a handful of companies dwarf everything else.
We tried charts first. They didn't carry the feeling. A table of 261 acquisitions reads as a table; a predator swimming through a school of fish and swallowing one reads as what actually happened. So we committed to the ocean, and to keeping it honest.
How it works
Every encoding on the map comes from the data, and the methodology panel (the small (i) button) explains each one. The short version:
- Who's included. Series A to C AI startups in the US and Europe, plus companies at an undisclosed stage and startups that have made acquisitions of their own. Crunchbase exports, refreshed regularly.
- Fish size is the average of two percentiles: Crunchbase rank and web traffic. Neither alone was fair, so we blended them.
- Distance from the whale is funding stage. Series A swims closest, Series C farthest, and undisclosed rounds sit between A and B.
- Schools are our classification of Crunchbase categories, with manual corrections where the categories were wrong.
- Being eaten. 261 startups acquired since 2023 are shown with their acquirer. Acquirers fall into eight groups: the frontier labs and big tech, compute providers, security companies, data platforms, enterprise software, industry incumbents, AI-native startups, and startups on the map that bought other startups.
- Predator size is the count of companies eaten, not deal value. Only 28 of 256 deals disclose a price, so we show prices where they exist and never total them.
Two honest limits. Crunchbase under-records shutdowns, so we track acquisitions, not deaths. And a few deals, like Apple and Huxe, are acqui-hires or licenses rather than clean acquisitions. We note them rather than hide them.
You can scrub through acquisitions on a timeline, drop into scuba mode to swim through a school, or pick any two companies and compare them head to head on funding, traffic and growth. Every comparison has its own share link.
Under the hood
The data pipeline is Python and pandas: load the exports, classify companies into schools, lay them out around the whale, and write one JSON file the viewer reads. Acquisitions get their own step that matches acquirers to predator groups and merges corrections.
The viewer is three.js. Every fish is one instance in a single InstancedMesh, which is what makes 1,400-plus animated fish run smoothly in a browser. Logos live in a single texture atlas. It's hosted on Vercel, with edge functions that generate a preview card for every head-to-head link so comparisons look right when shared.
One caveat: it's built for desktop. The instancing and logo atlas don't hold up on phones yet, so open it on a laptop.
Try it
Open thewhale.dev, hit search, and type your company or a competitor. See what school they swim in, and see who's circling.
If you work in data and the 1-in-23 figure bothers you as much as it bothers us, that's what Count is for.